A frequent topic of discussion at our Advisory Council meetings—and across NIH—is how to measure scientific output in ways that effectively capture scientific impact. We have been working on such issues with staff of the Division of Information Services in the NIH Office of Extramural Research. As a result of their efforts, as well as those of several individual institutes, we now have tools that link publications to the grants that funded them.
Using these tools, we have compiled three types of data on the pool of investigators who held at least one NIGMS grant in Fiscal Year 2006. We determined each investigator’s total NIH R01 or P01 funding for that year. We also calculated the total number of publications linked to these grants from 2007 to mid-2010 and the average impact factor for the journals in which these papers appeared. We used impact factors in place of citations because the time dependence of citations makes them significantly more complicated to use.
I presented some of the results of our analysis of this data at last week’s Advisory Council meeting. Here are the distributions for the three parameters for the 2,938 investigators in the sample set:
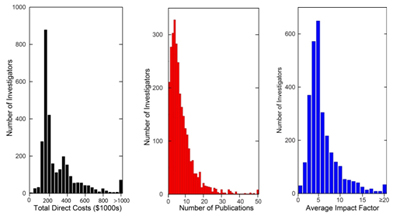
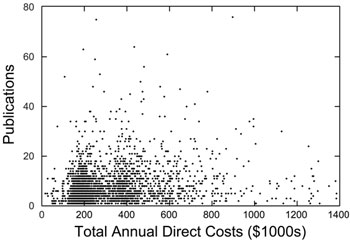
Histograms showing the distributions of total annual direct costs, number of publications linked to those grants from 2007 to mid-2010 and average impact factor for the publication journals for 2,938 investigators who held at least one NIGMS R01 or P01 grant in Fiscal Year 2006.
For this population, the median annual total direct cost was $220,000, the median number of grant-linked publications was six and the median journal average impact factor was 5.5.
A plot of the median number of grant-linked publications and median journal average impact factors versus grant total annual direct costs is shown below.
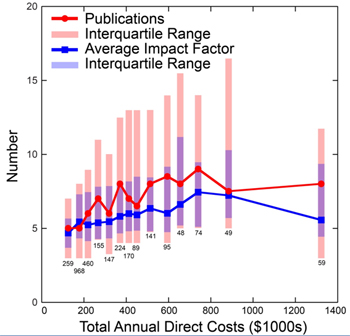
A plot of the median number of grant-linked publications from 2007 to mid-2010 (red circles) and median average impact factor for journals in which these papers were published (blue squares) for 2,938 investigators who held at least one NIGMS R01 or P01 grant in Fiscal Year 2006. The shared bars show the interquartile ranges for the number of grant-linked publications (longer red bars) and journal average impact factors (shorter blue bars). The medians are for bins, with the number of investigators in each bin shown below the bars.
This plot reveals several important points. The ranges in the number of publications and average impact factors within each total annual direct cost bin are quite large. This partly reflects variations in investigator productivity as measured by these parameters, but it also reflects variations in publication patterns among fields and other factors.
Nonetheless, clear trends are evident in the averages for the binned groups, with both parameters increasing with total annual direct costs until they peak at around $700,000. These observations provide support for our previously developed policy on the support of research in well-funded laboratories. This policy helps us use Institute resources as optimally as possible in supporting the overall biomedical research enterprise.
This is a preliminary analysis, and the results should be viewed with some skepticism given the metrics used, the challenges of capturing publications associated with particular grants, the lack of inclusion of funding from non-NIH sources and other considerations. Even with these caveats, the analysis does provide some insight into the NIGMS grant portfolio and indicates some of the questions that can be addressed with the new tools that NIH is developing.

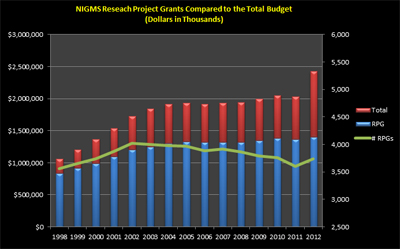
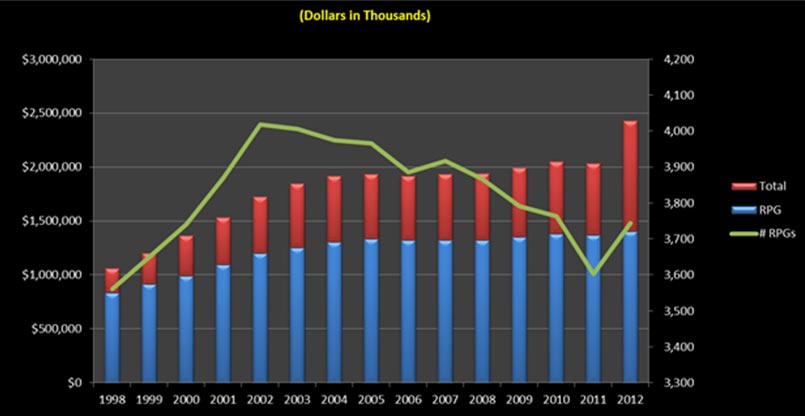
 budgets in Fiscal Years 1998-2012, compared to the total NIGMS budget.")

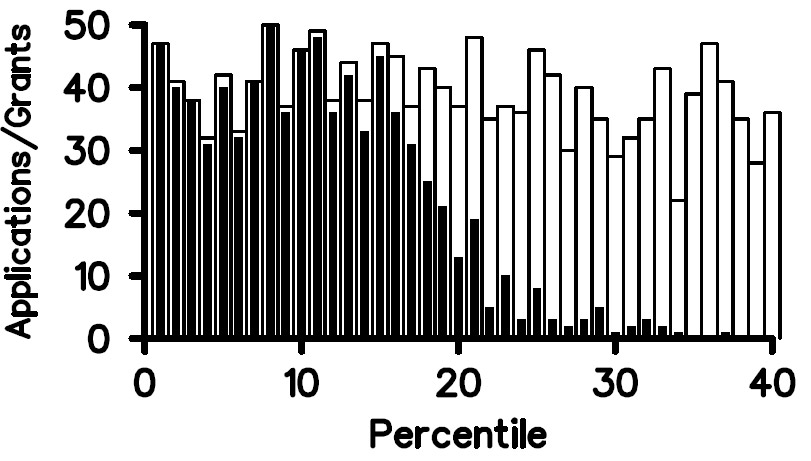
 and funded (solid bars) in Fiscal Year 2011.")

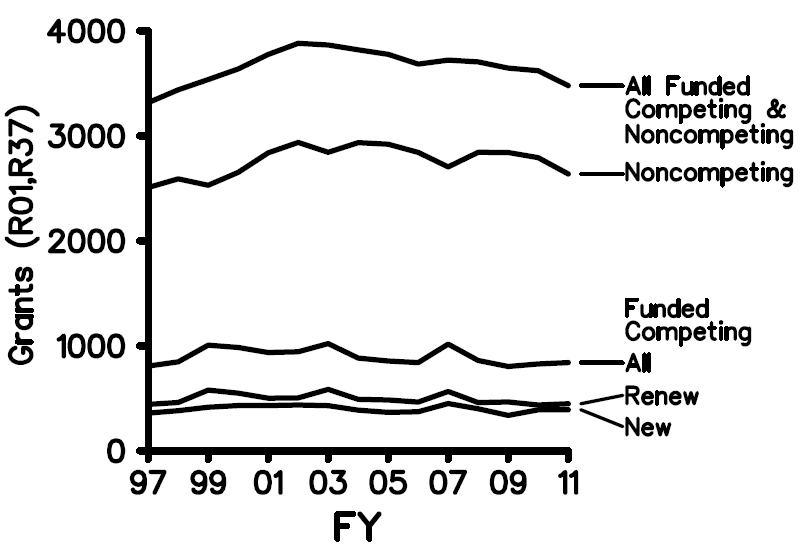
 funded in Fiscal Years 1997-2011.")
 received during Fiscal Years 1998-2012.")
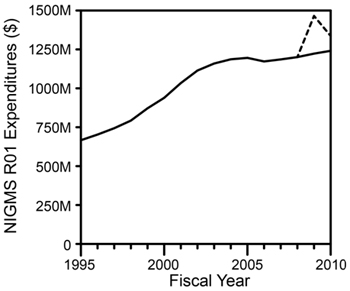
 in Fiscal Years 1995-2011")

 .
.
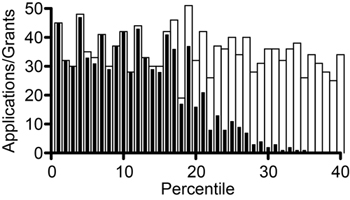
 and funded (solid bars) in Fiscal Year 2009. The thicker bars (blue) correspond to applications supported using regular appropriated funds, while the thinner bars (red) correspond to applications supported using Recovery Act funds (2-year awards).")
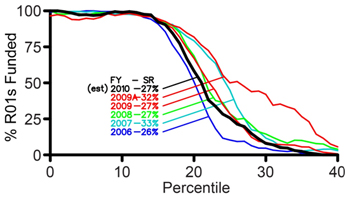
 corresponds to grants made with regular appropriated funds, while the thinner curve (red) includes grants made with both regular appropriated and Recovery Act (ARRA) funds.")
 (left, red) and the corresponding median direct cost for R01 grants (right, blue) in Fiscal Years 1995-2009. The dotted lines show the impact of awards (including supplements) made with Recovery Act funds. Results are in actual dollars with no correction for inflation.")