
The following data are related to an NIGMS Feedback Loop post from February 11, 2014, on Funding Trends and Factors Affecting Success Rate.
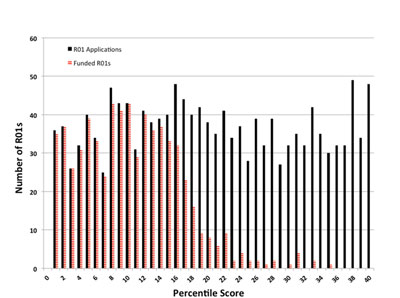
Figure 2. Number of competing R01 applications (solid black bars) assigned to NIGMS and number funded (striped red bars) in Fiscal Year 2013 as a function of percentile scores. The analysis includes competing types 1, 2 and 9 percentiled NIGMS R01 and R37 applications. If an A0 and A1 application for the same project were reviewed in the same fiscal year, both were counted. The horizontal axis is the application percentile score. Applications were grouped in bins that are centered on integral percentiles (0,1,2,….40) are 1 percentile unit wide; the bins do not overlap.