
The following data are related to an NIGMS Feedback Loop post from February 11, 2014, on Funding Trends and Factors Affecting Success Rate.
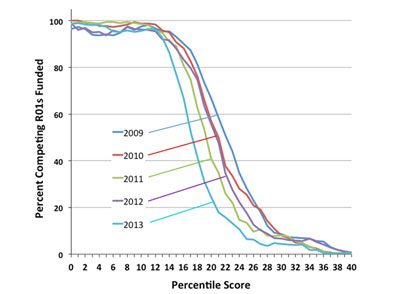
Figure 1. Percentage of competing R01 applications funded by NIGMS as a function of percentile scores for Fiscal Years 2009-2013. For Fiscal Year 2013, the success rate for R01 applications was 21%, and the midpoint of the funding curve was at approximately the 17th percentile. The analysis includes competing types 1, 2 and 9 percentiled NIGMS R01 and R37 applications. If an A0 and A1 application for the same project were reviewed in the same fiscal year, both were counted. The horizontal axis is the application percentile score. Applications were grouped in overlapping bins that are centered on integral percentiles (0,1,2,….40) and are 5 percentile units wide (from -2.5 percentile units to +2.4 percentile units).