Further Analysis of Renewal Rates for New and Established NIGMS Investigator Projects: Additional Data Analysis-Figure 1

The following data are related to an NIGMS Feedback Loop post from June 18, 2015, on Further Analysis of Renewal Rates for New and Established NIGMS Investigator Projects.

Figure 1 Weighted Publication Counts Per Million Dollars for New R01 Projects Funded by NIGMS in FY 2004-2007: No T2 Application, New Investigator: 211 projects, 1.4 weighted publications/$ million 25th percentile, 3.2 weighted publications/$ million median, 5.9 weighted publications/$ million 75th percentile; No T2 Application, Established Investigator: 343 projects, .9 weighted publications/$ million 25th percentile, 1.9 weighted publications/$ million median, 4 weighted publications/$ million 75th percentile; T2 Application, New Investigator: 543 projects, 2.7 weighted publications/$ million 25th percentile, 4.6 weighted publications/$ million median, 7.2 weighted publications/$ million 75th percentile; T2 Application, Established Investigator: 450 projects, 2.1 weighted publications/$ million 25th percentile, 3.9 weighted publications/$ million median, 6.4 weighted publications/$ million 75th percentile; T2 Not Funded, New Investigator: 270 projects, 2.3 weighted publications/$ million 25th percentile, 4.2 weighted publications/$ million median, 6.4 weighted publications/$ million 75th percentile; T2 Not Funded, Established Investigator: 209 projects, 1.7 weighted publications/$ million 25th percentile, 2.8 weighted publications/$ million median, 4.7 weighted publications/$ million 75th percentile; T2 Funded, New Investigator: 273 projects, 3.0 weighted publications/$ million 25th percentile, 5.2 weighted publications/$ million median, 8.3 weighted publications/$ million 75th percentile; T2 Funded, Established Investigator: 241 projects, 2.9 weighted publications/$ million 25th percentile, 4.8 weighted publications/$ million median, 7.7 weighted publications/$ million 75th percentile.

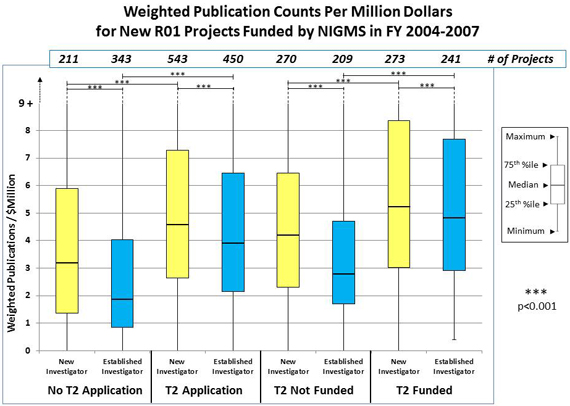
Figure 1. Weighted publication numbers per million dollars of total cost for new R01 projects from new and established investigators funded by NIGMS between Fiscal Years 2004-2007. All publications (retrieved from SPIRES) were counted that cited the NIGMS grant and that were published within 5 years following the fiscal year of the initial award (the outcome was similar when only counting publications that were published within 4 years following the fiscal year of the initial award). To determine weighting factors for each publication associated with a given R01 grant, the number (n) of acknowledged NIH research grants was counted  (excluding SBIR/STTR, infrastructure, training and conference grants). For example, if four research grants were acknowledged (n=4), this publication contributed only 0.25 to the sum of publications for this project. Within this cohort, publications from established investigator projects acknowledged, on average, 2.0 NIH research grants, and publications from new investigators acknowledged, on average, 1.7 NIH grants. Using weighted publication counts affected the results of established investigator projects more strongly than they did for new investigator projects. Each category included a few extreme positive outliers with 80-100 publications, and most categories contained at least one project with no publications. Since arithmetic means are more sensitive to a few high-performing outliers, median values were used throughout the analysis and for statistical evaluation to compare distributions across categories.

The overall pattern in the distributions was similar when analyzing unweighted publication numbers either with or without stratification for million dollars appropriated (see Figures 1A and 1B), except for the category of "T2 Funded," where the distribution of unweighted publication counts per million dollars of total cost was higher for established investigator projects than for new investigator projects.

Figure 1A Unweighted Publication Counts: No T2 Application, New Investigator, 211 projects, unweighted publications, 3 25th percentile, 7 median, 11 75th percentile; No T2 Application, Established Investigator, 343 projects, unweighted publications, 2 25th percentile, 4 median, 8 75th percentile; T2 Application, New Investigator, 543 projects, unweighted publications, 6 25th percentile, 10 median, 15 75th percentile; T2 Application, Established Investigator, 450 projects, unweighted publications, 5 25th percentile, 9 median, 14 75th percentile; T2 Not Funded, New Investigator, 270 projects, unweighted publications, 5 25th percentile, 9 median, 13 75th percentile; T2 Not Funded, Established Investigator, 209 projects, unweighted publications, 4  25th percentile, 6 median, 10 75th percentile; T2 Funded, New Investigator, 273 projects, unweighted publications, 7 25th percentile, 12 median, 17 75th percentile; T2 Funded, Established Investigator, 241 projects unweighted publications, 7 25th percentile, 11 median, 17 75th percentile.

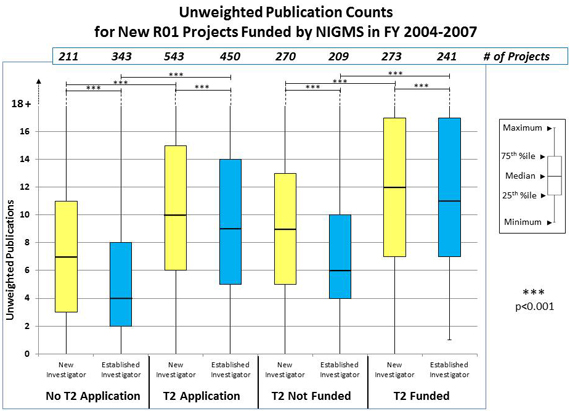
Figure 1A. Unweighted publication numbers for new R01 projects from new and established investigators funded by NIGMS between Fiscal Years 2004-2007.

Figure 1B: No T2 Application, New Investigator, 211 projects, unweighted publications, 2.2 25th percentile, 4.7 median, 7.6 75th percentile; No T2 Application, Established Investigator, 343 projects, unweighted publications, 1.6 25th percentile, 3.2 median, 6.2 75th percentile; T2 Application, New Investigator, 543 projects, unweighted publications, 3.5 25th percentile, 6.1 median, 9.4 75th percentile; T2 Application, Established Investigator, 450 projects, unweighted publications, 3.7 25th percentile, 5.9 median, 9.4 75th percentile; T2 Not Funded, New Investigator, 270 projects, unweighted publications, 3.2 25th percentile, 5.1 median, 8.7 75th percentile; T2 Not Funded, Established Investigator, 209 projects, unweighted publications, 2.5 25th percentile, 4.7 median, 7 75th percentile; T2 Funded, New Investigator, 273 projects, unweighted publications, 4.2 25th percentile, 7 median, 10.1 75th percentile; T2 Funded, Established Investigator, 241 projects, unweighted publications, 4.8 25th percentile, 7.1 median, 11.2 75th percentile.

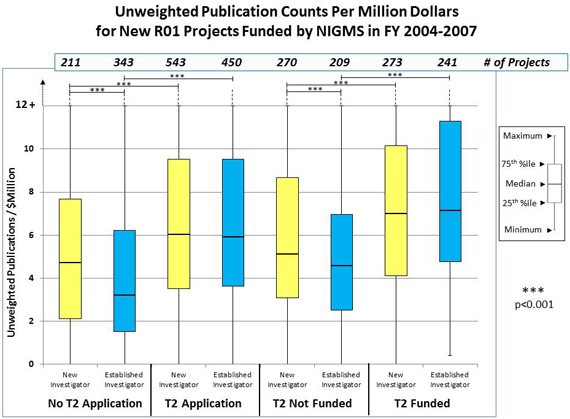
Figure 1B. Unweighted publication numbers per million dollars of total cost for new R01 projects from new and established investigators funded by NIGMS between Fiscal Years 2004-2007. At NIGMS, most new investigator R01 grants receive 5 years of funding, while established investigator projects receive 4 years of funding. Therefore, on average, stratification by total cost decreased publication numbers per million dollars more strongly for new investigator projects than for established investigator projects.

Figure 1C Comparison of Publication Counts: Publications, New Investigator, 754 projects, 4 25th percentile, 7 median, 11 75th percentile; Publications, Established Investigator, 793 projects, 3 25th percentile, 6 median, 8.9 75th percentile; Publications/$Million, New Investigator, 754 projects, 3 25th percentile, 5.6 median, 9 75th percentile; Publications/$Million, Established Investigator, 793 projects, 2.5 25th percentile, 4.7 median, 7.9 75th percentile; Weighted Publications/$Million, New Investigator, 754 projects, 2.3 25th percentile, 4.4 median, 7 75th percentile; Weighted Publications/$Million, Established Investigator, 793 projects, 1.4 25th percentile 2.9, median, 5.3 75th percentile.

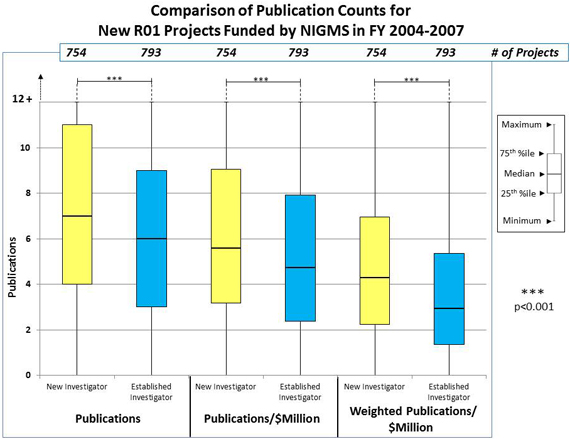
Figure 1C. Comparison of publication numbers for all new R01 projects from new and established investigators funded by NIGMS between Fiscal Years 2004-2007. Overall, new investigator projects had a higher publication rate than new established investigator projects.