
The following data are related to an NIGMS Feedback Loop post from June 18, 2015, on Further Analysis of Renewal Rates for New and Established NIGMS Investigator Projects.
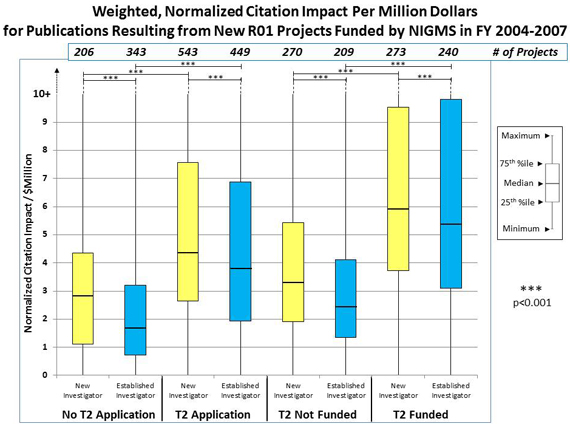
Figure 3. Distribution of the weighted, normalized citation impact for publications per million dollars of total cost for new R01 projects from new and established investigators funded by NIGMS between Fiscal Years 2004-2007. The normalized citation impact for each publication was obtained from the Thompson Reuters InCites database (Bornmann & Marx, 2013, Kaltman et al., 2014, Danthi et al., 2014). It assigns a value between 0 and 1 to each publication and is a measure of the publication’s relative impact normalized for scientific discipline, type of publication (e.g., research article, review, commentary) and publication year. For example, a value of 1 designates publications that were cited the highest compared to other papers within the same scientific discipline, year and publication type. For those projects that resulted in no publications, the summary value was set to 0.
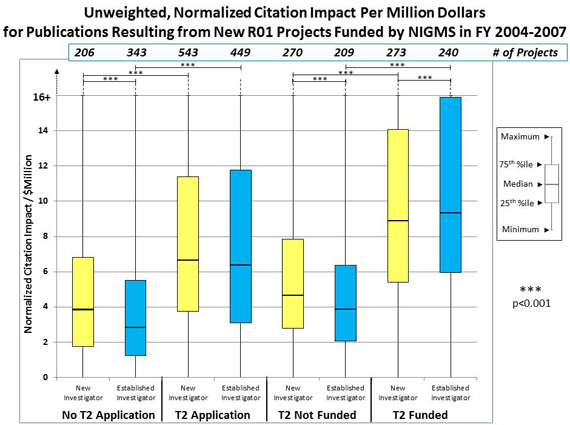
Figure 3A. Distribution of the unweighted, normalized citation impact for publications per million dollars of total cost for new R01 projects from new and established investigators funded by NIGMS between Fiscal Years 2004-2007.