
The following data are related to an NIGMS Feedback Loop post from April 20, 2016, on P01 Outcomes Analysis.
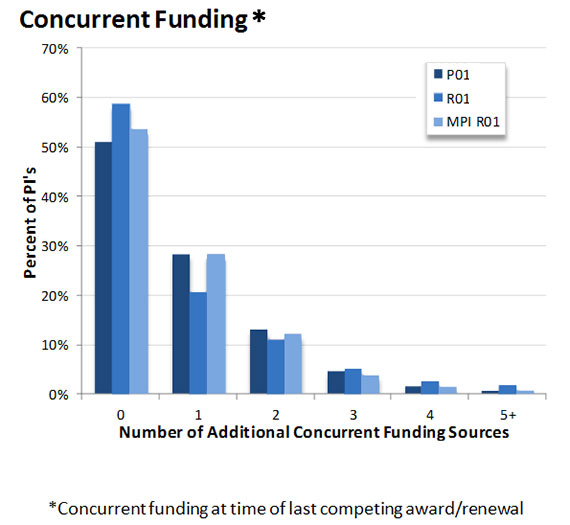
Figure 6. This histogram displays the distribution of investigators who have NIGMS P01, R01, or multi-PI R01 research grants alone or who have additional sources of concurrent NIH funding. All categories of grants (P01, dark blue bars; Single-PI R01, lighter blue bars; Multi-PI R01, lightest blue bars) display similar distributions. Thus, PIs of P01s, R01s and MPI R01s are equally likely to have other sources of NIH funding, with the majority of other grants held by the PIs being R01s.