
After reading yesterday’s post, a Feedback Loop reader asked for a full regression analysis of the overall impact score based on all five criterion scores. With the caveat that one should be cautious in over-interpreting such analyses, here it is:
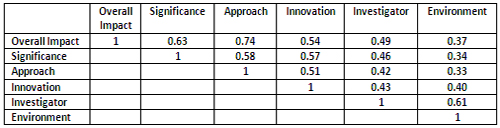
As one might expect, the various parameters are substantially correlated.
A principal component analysis reveals that a single principal component accounts for 71% of the variance in the overall impact scores. This principal component includes substantial contributions from all five criterion scores, with weights of 0.57 for approach, 0.48 for innovation, 0.44 for significance, 0.36 for investigator and 0.35 for environment.
Here are more results of the full principal component analysis:
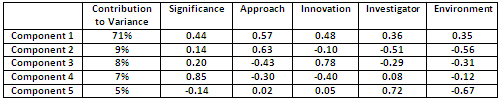
The second component accounts for an additional 9% of the variance and has a substantial contribution from approach, with significant contributions of the opposite sign for investigator and environment. The third component accounts for an additional 8% of the variance and appears to be primarily related to innovation. The fourth component accounts for an additional 7% of the variance and is primarily related to significance. The final component accounts for the remaining 5% of the variance and has contributions from investigator and environment of the opposite sign.
I wish I could believe all of these statistics tell me how grants get scores high enough to pass the funding hurdle without crashing.
But after many years on study sections at CSR, it is very clear that the criterion not amenable to statistics is politics. Does the PI have a friend on the study section? Does the applicant come from a lab whose PI is a friend of a study section member? Did the PI give a nice talk at Cold Spring Harbor?
CSR study sections are inbred and serve to raise the scores of the people associated with them. Things like innovation and significance are in the eyes of the beholder.
It is not that this is something new. Politics has always served to fill the pipeline but in the past the funding levels have been high enough to allow some good grants access to money. Now it appears hopeless.
Most of the variance (PC1) is accounted for by something you could abbreviate as ‘I like it’. This is plausibly attributed largely to the ‘success breeds success’ or ‘the rich get richer’ principle although this can’t be asserted with confidence. For this component there is honestly little reason to bother with a study section meeting, scores, reviews, etc.
The next three PCs are amusing from a cynical point of view.
PC2 scores high with a great set of experiments from an investigator/environment combination not inspiring confidence.
PC3 scores high with highly innovative proposals with terrible approach (a.k.a. ‘we don’t know for sure that this will work’).
PC4 scores high with proposals in an important area but dumb and/or non-innovative (one would hope not both at once, since this would suggest that all conventional approaches are also unlikely to work!).
PC5 scores high with proposals from a great investigator in a terrible environment. Relatively unusual, and therefore only 5% of the variance.
1. It would be interesting to track average scores in each category as well as the correlations as a function of time, as reviewers get more used to the system.
2. A high correlation is expected because the individual items are in fact very closely correlated. It is somewhat artificial to break separately score the items.
3. Environment is useless as a scored item. It should be a yes/no; if the resources won’t allow the grant to be done (rare) it should be a no and disqualify grant. otherwise, it doesn’t add anything, except an artificial boost to investigators at the Harvards and Stanfords of the world.
It would be nice if a regression is done using data from the 360 R01 grants, where the Overall Impact score is the dependent variable, and the 5 Criterion scores are all in the regression model as predictors. This way we can find the relative importance of the 5 Criterion scores to the Overall Impact score.