
As part of our program assessment process, we have analyzed NIGMS program project (P01) grants to improve our understanding of how their outcomes compare with those of other mechanisms.
The most recent NIGMS funding opportunity announcement for P01s states that individual projects “must be clearly interrelated and synergistic so that the research ideas, efforts, and outcomes of the program as a whole will offer a distinct advantage over pursuing the individual projects separately.” From this perspective, we sought to address three major questions:
- Do P01s achieve synergies above and beyond a collection of separate grants?
- How do the results from P01s compare with those from R01s?
- Do certain fields of science need P01s more than others?
To address these questions, we analyzed the outcomes of P01 grants using several different metrics and compared these outcomes to those of two comparator groups: single-principal investigator (PI) R01s and multiple-PI R01s. Since P01s could be considered as a collection of single-PI R01s and one or more cores, we chose single-PI R01s as a comparator group. Because a major facet of P01s is their focus on using collaborative approaches to science, we also wanted to compare their outcomes to another collaboration-focused research grant: multiple-PI R01s. While structurally different from P01s, multiple-PI R01s allow for a comparison between two competing models of funding team science within the NIGMS portfolio.
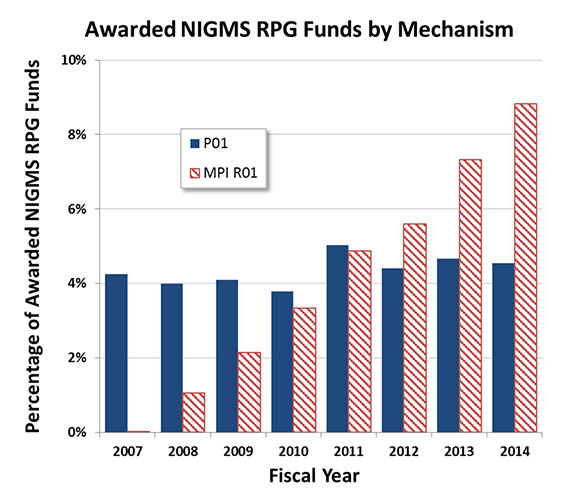
Figure 1 charts both P01s and multiple-PI R01s as a percentage of funds for awarded NIGMS research project grant (RPG). While the proportion of awarded RPG1 funds going to P01s has remained relatively flat since 2007, the share going to multiple-PI R01s has increased dramatically since their introduction, indicating strong demand for this type of mechanism within the community. To test for any field-specific biases, we also utilized text analysis to assess grant abstracts and specific aims from funded grants in these two groups and found that the mechanisms support similar research areas within the NIGMS portfolio (data not shown).
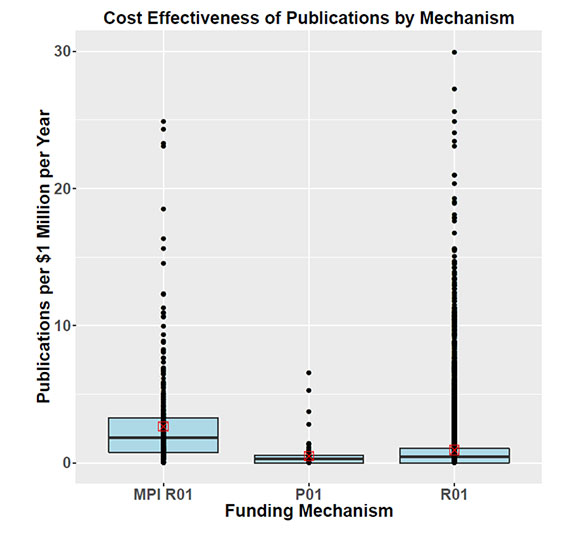
To determine whether P01s achieve synergies beyond those of R01s, we looked for differences in both productivity, as measured by publications, and impact, as measured by two different citation metrics. For publications, because P01s generally have much larger budgets than do R01s and multiple-PI R01s, comparing total publication counts would be misleading. Therefore, we assessed the cost-effectiveness of publications for each of the three grant mechanisms normalized by years and award size. The results, shown in Figure 2, suggest that multiple-PI R01s outperformed both P01s and single-PI R01s in terms of cost-effectiveness of publications. The same holds true when publications are weighted by the number of grants they cite (data not shown) to control for funds contributed to a project from additional sources.
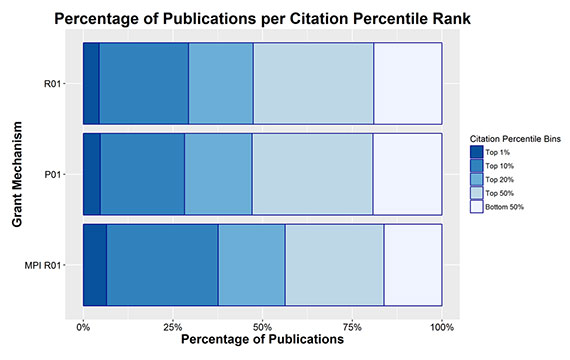
To assess whether P01s achieve synergies in terms of their impact, we looked at several different measures of impact. Figure 3 charts publications for both P01s and multiple-PI R01s in order of their citation percentile rank. An average distribution would be expected to have 1% of publications in the top 1% for citations, 10% in the top 10%, and so on. P01s had a greater proportion of highly cited publications than the average, with 5% of their publications in the top 1% of citations, 28% in the top 10% and 47% in the top 20%. Multiple-PI R01s had an even greater degree of enrichment in terms of highly cited publications, with 6% in the top 1%, 37% in the top 10% and a full 56% in the top 20%. In comparison, single-PI R01s had 4% of their publications in the top 1%, 29% in the top 10% and 47% in the top 20%–very similar to the values for P01s.
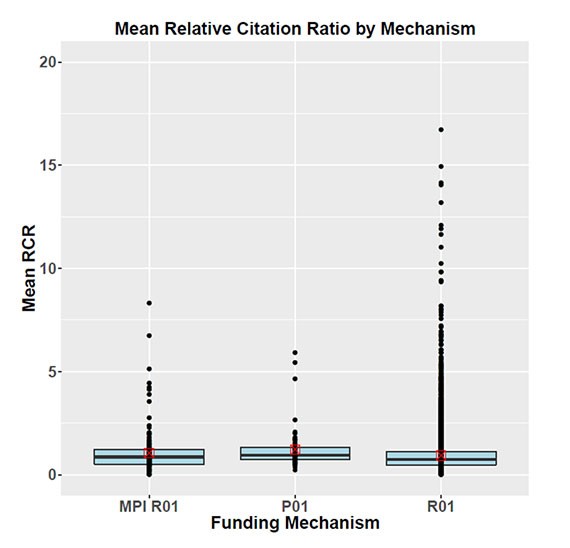
Although the citation percentile rank is normalized for field and year, there may still be concerns with comparing citations across different fields due to differing citation patterns, field sizes and other parameters. To address this potential issue, we applied another metric of impact known as the relative citation ratio (RCR), which allows for comparison across scientific areas. If the RCR equals 1, it means that the publication in question received the average number of citations as a publication in its field. If the RCR is less than 1, it means that the publication received fewer citations than the average, and if the RCR is greater than 1, it means that the publication received more citations than the average. Figure 4 plots the mean RCR for each grant by mechanism, showing there was no statistically significant difference in impact as measured by RCR.
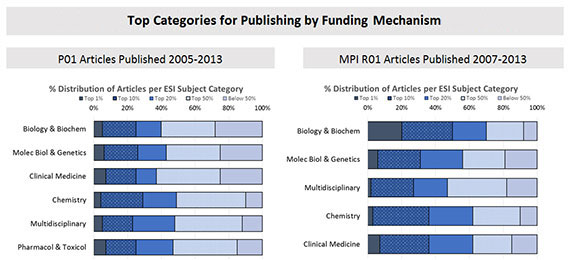
To address the question of whether certain research areas require a P01, we examined the top fields in which papers arising from P01s and multiple-PI R01s were published (Figure 5). The results suggest that there is a great deal of overlap, at least in terms of these broad categories.
Although these analyses certainly do not answer every important question about the optimal ways to fund collaboration and team science, they provide data that will inform the Institute’s efforts to develop the most efficient and effective mechanisms and policies to support a broad, diverse and vibrant portfolio of fundamental biomedical research.
Note
RPG funds include the following grant mechanisms: DP1, DP2, R01, R03, R15, R00, R21, R29, R33, R34, R37, P01, U01 and U19.
In the interests of rigor and reproducibility, I am interested in why there was no statistical analysis accompanying these comparisons. Are any of the differences statistically significant (it’s not clear any are)? Should policy be informed by statistically insignificant findings? To do the proper statistics, of course, it would be best to have some understanding of why the data distributions are so different for the different mechanisms (one clear effect is regression to the mean — because P01s aggregate the efforts of multiple projects, one expects the variance to be lower, which it clearly is–thus the impression that a subset of R01s do massively better than P01s is at least in part an artifact).
As worrisome as the statistical issues are the multiple things that were “corrected for” (little data are given on how this was done, or whether it was done well) and several things that were not. For example, some R01s get renewed over and over again, while P01s tend to get renewed less often (this makes statistical sense as P01s face “multiple jeopardy” each time they are reviewed). Much of the most important long term impact of a research project is in the future work it enables, but once a grant ends, the future work it enables tends to get attributed to new grants that more directly support that work. Thus, the more a grant gets renewed, the more the work it enables tends to get “captured” in the net of things that are attributed to that grant. Thus, different renewal rates should have been corrected for (e.g. by equalizing the distributions of grant years within the comparisons).
Among the things that we are told were corrected for, the one that seems most worrisome is the correction for attribution of publications to multiple grants, which we are told was done in “data not shown” and came out “the same”. Was credit simply divided proportionally? Did statistical significance go up or down?
I commend the NIGMS for trying to tackle the problem of metrics, but these kinds of relatively superficial analyses remind me of two aphorisms. The first is “not everything that can be counted counts, and not everything that counts can be counted”, and the second is “a little bit of knowledge is a dangerous thing”. I hope that the NIGMS keeps these truths in mind when deciding whether to take actions based on findings such as those discussed in this analysis.
Thank you for your comments. In comparing the cost effectiveness of publications, multiple-PI R01s outperformed both P01s and single-PI R01s, and a Wilcoxon test showed this difference was statistically significant (p < 0.05) for both weighted and unweighted publications. For RCR, there were no statistically significant differences between the three mechanisms (p > 0.05).
I found both the analysis presented by Dorsey and the comment by Lander to be both interesting and informative. However neither touches what I feel is a critical point about P01s. A number of years ago my group began applying some unique technology that we had developed for materials science to biochemical and eventually biological problems. Coming from Chemical Physics I had never even thought about applying for support from the NIH even though I am a quite senior investigator. It rapidly became apparent to me, however that in order to pursue this research I did need to begin collaboration with biologists both to obtain insight into the important problems and to obtain the molecules/materials needed to pursue them. Consequently I did a literature search in an area of interest (amyloid mechanisms and related diseases), contacted a potential collaborator, visited and exchanged emails and started collaborating. After a slow but required induction period we published a couple of papers and I became a part of a P01 grant application. The P01 was funded and we were off and running. Five years later we attempted to renew the grant, were stalled a year by the NIH, eventually submitted and were denied in spite of a sterling publication record of very highly cited papers. In a very unusual circumstance my portion of the second P01 was eventually funded by the institute under Director discretionary funds as an R01 which is heading into its terminal year. The points I want to make are that the P01 mechanism allows for the entry of new ideas, technology and people into NIH funding where they can make unique and perhaps seminal contributions to both understanding and curing diseases. I would never have initially been funded on my own by the NIH and face an uncertain future as I now try to get an R01 renewal funded even though I have established a profile of successful publication on important problems. I have approached my collaborator about a new P01 but he is not optimistic and feels the NIH is abandoning this funding mechanism. I can’t help but agree, especially after reading the analysis by Dorsey that has apparently already been presented to the Council.
I wonder if multi-PI grants yield “more” publications simply because PIs involved in them are more likely to be collaborative and they are more likely to cite multiple sources of funding on each paper. Multi-PI grants seem likely to be held by PIs who have other sources of funding (their ‘own’ grants) so the practice of citing multiple sources per paper seems more likely for that reason as well.
Would be interesting to see, of those papers that are credited to multi-PI grants, do they cite more sources of funding per paper than papers credited to single-PI grants?
PIs of P01s, R01s and MPI R01s are equally likely to have other sources of NIH funding (see figure). In addition, as mentioned in the post, correcting for the number of other grants cited in publications does not change the outcome for publication productivity.
The citation of multiple sources of funding is an enormous issue that the NIH has assiduously avoided. This extends all the way down to the study section level where the productivity of PI’s with a single RO-1 and few collaborations is routinely compared to that of PI’s with multiple grants (NIH, or, e.g., DOD or HHMI) — and where the key papers used to judge productivity often do, in fact, cite multiple funding sources.
This is a major component of the current rich-get-richer/winner-take-all system, and it is hard to believe that the systematic failure to examine or compensate for these biases is unintentional. In other words, it’s not a bug, but a feature.
We appreciate your concern about PIs citing multiple funding sources in their publications and the potential biases this can cause. On the NIGMS website we have a policy about attribution of NIH/NIGMS support, which says in part, "If you have more than one grant, only cite the one(s) that supported the research described in the article or presentation." It’s true that some PIs do not observe this, but I want to assure you that when NIGMS program staff make funding decisions they always consider a PI’s other support and the lab’s overall level of productivity and impact, and don’t just count papers. There are, however, cases where more than one grant legitimately supports a publication.
This analysis of outcomes of multi-investigator R01, P01, and R01 grants needs a great deal of further work and analysis before any of its conclusions should be used in the determination of policy. As presented, Fig. 2 appears to show an astounding result, then a control analysis in Fig. 3 shows a much smaller effect, and finally the most careful analysis in Fig. 4 shows no effect at all (actually a reversal of the effect).
The results shown in Fig. 2 are indeed astounding. This figure shows that, per dollar spent, multi-investigator R01 grants are associated with 6 times as many publications as a P01 and 4 times as many as an R01. The implied interpretation is that somehow this mechanism of funding leads to astonishingly high levels of publication.
This result, although amazing, is completely implausible. Consider the comparison of P01 vs multi-investigatory R01.
What is the difference between the grants? It is that the multi-investigator ones are smaller. Let’s just assume that on average they are about 3 times smaller. This would mean that for 3 times less money, you get twice the output. It is ludicrous to think that if you just took P01 grants, cut the budgets by 3 making them into multi-investigator P01 grants, you would double the output.
What does this mean? It means that something else is going on. For example, maybe, just maybe, P01 grants attack harder and bigger problems than R01 or multi-investigator grants. Or maybe the way grants are cited in papers are systematically different in these different categories. Or maybe something else is different.
Now consider the remainder of the results in this analysis. Fig. 3 is a more careful analysis that takes into account the citations of papers. It shows that multi-investigator R01 grants are just 1.5 times more lead to papers in the top 1% of publications than either P01 or R01 grants.
Finally, Fig. 4 shows that if you consider the least biased type of analysis, the relative citation ratio, there is no significant difference at all among the multi-investigator R01, P01, and R01 categories at all. (In fact the P01 is slightly higher than the other two in this analysis).
What can we conclude overall? First, the dramatic result in Fig. 2 is extremely unlikely to mean what it seems to mean. Much more analysis of what is different among these grants or the way the results are reported are necessary. Second, we can conclude that the results are so inconsistent that we should not pick one of these figures to show as indicating something about the relative productivity of these three granting categories. We would draw opposite conclusions if we only had Fig. 2 or Fig. 4.
If I had to choose which of the three analyses shown in the posting is most likely to reflect the output of the three granting types, it would probably the least biased analysis in Fig. 4 which shows that all the granting types are just about the same when controlled for the scientific area.
It is also worth noting that P01 awards are often used to support facilities, such as X-ray or NMR laboratories. Indeed, one of the major incentives for applying for a P01 is the capacity to support major infra-structure. But the dollars going to support the infrastructure are not going to support day-to-day research, so that the total P01s budget may not be the best metric for normalizing research expenditures.