Tag: Peer Review Process

Long-Time Scientific Review Chief Helen Sunshine Retires

5 comments

Dr. Helen SunshineHelen Sunshine, who led the NIGMS Office of Scientific Review (OSR) for the last 27 years, retired in April. Throughout her career, she worked tirelessly to uphold the highest standards of peer review.

Helen earned a Ph.D. in chemistry at Columbia University and joined the NIH intramural program in 1976, working first as a postdoctoral fellow and then as a senior research scientist in the Laboratory of Chemical Physics, headed by William Eaton.

In 1981, Helen became a scientific review officer (SRO) in OSR and was appointed by then-NIGMS Director Ruth L. Kirschstein to be its chief in 1989. During her career in OSR, she oversaw the review of many hundreds of applications each year representing every scientific area within the NIGMS mission.

Continue reading “Long-Time Scientific Review Chief Helen Sunshine Retires”

Talking to NIH Staff About Your Application and Grant: Who, What, When, Why and How

2 comments

Update: Revised content in this post is available on the NIGMS webpage, Talking to NIH Staff About Your Application and Grant.

During the life of your application and grant, you’re likely to interact with a number of NIH staff members. Who’s the right person to contact—and when and for what? Here are some of the answers I shared during a presentation on communicating effectively with NIH at the American Crystallographic Association annual meeting. The audience was primarily grad students, postdocs and junior faculty interested in learning more about the NIH funding process.

Who?

The three main groups involved in the application and award processes—program officers (POs), scientific review officers (SROs) and grants management specialists (GMSs)—have largely non-overlapping responsibilities. POs advise investigators on applying for grants, help them understand their summary statements and provide guidance on managing their awards. They also play a leading role in making funding decisions. Once NIH’s Center for Scientific Review (CSR) assigns applications to the appropriate institute or center and study section, SROs identify, recruit and assign reviewers to applications; run study section meetings; and produce summary statements following the meetings. GMSs manage financial aspects of grant awards and ensure that administrative requirements are met before issuing a notice of award.

How do you identify the right institute or center, study section and program officer for a new application? Some of the more common ways include asking colleagues for advice and looking at the funding sources listed in the acknowledgements section of publications closely related to your project. NIH RePORTER is another good way to find the names of POs and study sections for funded applications. Finally, CSR has information on study sections, and individual institute and center websites, including ours, list contacts by research area. We list other types of contact information on our website, as well.

Continue reading “Talking to NIH Staff About Your Application and Grant: Who, What, When, Why and How”

Becoming a Peer Reviewer for NIGMS

2 comments

NIH’s Center for Scientific Review (CSR) is not the only locus for the review of grant applications–every institute and center has its own review office, as well. Here at NIGMS, the Office of Scientific Review (OSR) handles applications for a wide variety of grant mechanisms and is always seeking outstanding scientists to serve as reviewers. If you’re interested in reviewing for us, here’s some information that might help.

Continue reading “Becoming a Peer Reviewer for NIGMS”

Why Overall Impact Scores Are Not the Average of Criterion Scores

10 comments

One of the most common questions that applicants ask after a review is why the overall impact score is not the average of the individual review criterion scores. I’ll try to explain the reasons in this post.

What is the purpose of criterion scores?

Criterion scores assess the relative strengths and weaknesses of an application in each of five core areas. For most applications, the core areas are significance, investigator(s), innovation, approach and environment. The purpose of the scores is to give useful feedback to PIs, especially those whose applications were not discussed by the review group. Because only the assigned reviewers give criterion scores, they cannot be used to calculate a priority score, which requires the vote of all eligible reviewers on the committee.

How do the assigned reviewers determine their overall scores?

The impact score is intended to reflect an assessment of the “likelihood for the project to exert a sustained, powerful influence on the research
field(s) involved.” In determining their preliminary impact scores, assigned reviewers are expected to consider the relative importance of each scored review criterion, along with any additional review criteria (e.g., progress for a renewal), to the likely impact of the proposed research.

The reviewers are specifically instructed not to use the average of the criterion scores as the overall impact score because individual criterion scores may not be of equal importance to the overall impact of the research. For example, an application having more than one strong criterion score but a weak score for a criterion critical to the success of the research may be judged unlikely to have a major scientific impact. Conversely, an application with more than one weak criterion score but an exceptionally strong critical criterion score might be judged to have a significant scientific impact. Moreover, additional review criteria, although not individually scored, may have a substantial effect as they are factored into the overall impact score.

How is the final overall score calculated?

The final impact score is the average of the impact scores from all eligible reviewers multiplied by 10 and then rounded to the nearest whole number. Reviewers base their impact scores on the presentations of the assigned reviewers and the discussion involving all reviewers. The basis for the final score should be apparent from the resume and summary of discussion, which is prepared by the scientific review officer following the review.

Why might an impact score be inconsistent with the critiques?

Sometimes, issues brought up during the discussion will result in a reviewer giving a final score that is different from his/her preliminary score. If this occurs, reviewers are expected to revise their critiques and criterion scores to reflect such changes. Nevertheless, an applicant should refer to the resume and summary of discussion for any indication that the committee’s discussion might have changed the evaluation even though the criterion scores and reviewer’s narrative may not have been updated. Recognizing the importance of this section to the interpretation of the overall summary statement, NIH has developed a set of guidelines to assist review staff in writing the resume and summary of discussion, and implementation is under way.

If you have related questions, see the Enhancing Peer Review Frequently Asked Questions.

Editor’s Note: In the third section, we deleted “up” for clarity.

Productivity Metrics and Peer Review Scores, Continued

11 comments

In a previous post, I described some initial results from an analysis of the relationships between a range of productivity metrics and peer review scores. The analysis revealed that these productivity metrics do correlate to some extent with peer review scores but that substantial variation occurs across the population of grants.

Here, I explore these relationships in more detail. To facilitate this analysis, I separated the awards into new (Type 1) and competing renewal (Type 2) grants. Some parameters for these two classes are shown in Table 1.

Table 1. Selected=

Table 1. Selected parameters for the population of Type 1 (new) and Type 2 (competing renewal) grants funded in Fiscal Year 2006: average numbers of publications, citations and highly cited citations (defined as those being in the top 10% of time-corrected citations for all research publications).

For context, the Fiscal Year 2006 success rate was 26%, and the midpoint on the funding curve was near the 20th percentile.

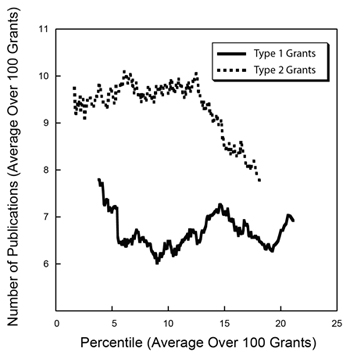
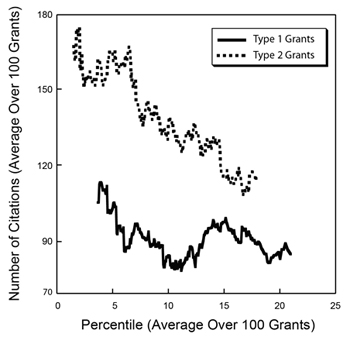
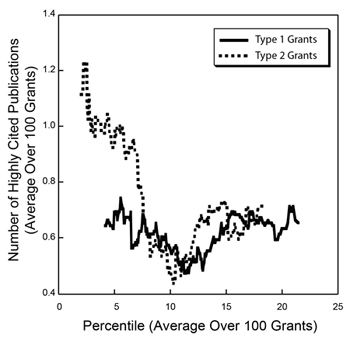
To better visualize trends in the productivity metrics data in light of the large amounts of variability, I calculated running averages over sets of 100 grants separately for the Type 1 and Type 2 groups of grants, shown in Figures 1-3 below.

Figure 1. Running averages for the number of publications over sets of 100 grants funded in Fiscal Year 2006 for Type 1 (new, solid line) and Type 2 (competing renewal, dotted line) grants as a function of the average percentile for that set of 100 grants.

Figure 1. Running averages for the number of publications over sets of 100 grants funded in Fiscal Year 2006 for Type 1 (new, solid line) and Type 2 (competing renewal, dotted line) grants as a function of the average percentile for that set of 100 grants.

Figure 2. Running averages for the number of citations over sets of 100 grants funded in Fiscal Year 2006 for Type 1 (new, solid line) and Type 2 (competing renewal, dotted line) grants as a function of the average percentile for that set of 100 grants.

Figure 2. Running averages for the number of citations over sets of 100 grants funded in Fiscal Year 2006 for Type 1 (new, solid line) and Type 2 (competing renewal, dotted line) grants as a function of the average percentile for that set of 100 grants.

Figure 3. Running averages for the number of highly cited publications over sets of 100 grants funded in Fiscal Year 2006 for Type 1 (new, solid line) and Type 2 (competing renewal, dotted line) grants as a function of the average percentile for that set of 100 grants.

Figure 3. Running averages for the number of highly cited publications over sets of 100 grants funded in Fiscal Year 2006 for Type 1 (new, solid line) and Type 2 (competing renewal, dotted line) grants as a function of the average percentile for that set of 100 grants.

These graphs show somewhat different behavior for Type 1 and Type 2 grants. For Type 1 grants, the curves are relatively flat, with a small decrease in each metric from the lowest (best) percentile scores that reaches a minimum near the 12th percentile and then increases somewhat. For Type 2 grants, the curves are steeper and somewhat more monotonic.

Note that the curves for the number of highly cited publications for Type 1 and Type 2 grants are nearly superimposable above the 7th percentile. If this metric truly reflects high scientific impact, then the observations that new grants are comparable to competing renewals and that the level of highly cited publications extends through the full range of percentile scores reinforce the need to continue to support new ideas and new investigators.

While these graphs shed light on some of the underlying trends in the productivity metrics and the large amount of variability that is observed, one should be appropriately cautious in interpreting these data given the imperfections in the metrics; the fact that the data reflect only a single year; and the many legitimate sources of variability, such as differences between fields and publishing styles.

Productivity Metrics and Peer Review Scores

18 comments

A key question regarding the NIH peer review system relates to how well peer review scores predict subsequent scientific output. Answering this question is a challenge, of course, since meaningful scientific output is difficult to measure and evolves over time–in some cases, a long time. However, by linking application peer review scores to publications citing support from the funded grants, it is possible to perform some relevant analyses.

The analysis I discuss below reveals that peer review scores do predict trends in productivity in a manner that is statistically different from random ordering. That said, there is a substantial level of variation in productivity metrics among grants with similar peer review scores and, indeed, across the full distribution of funded grants.

I analyzed 789 R01 grants that NIGMS competitively funded during Fiscal Year 2006. This pool represents all funded R01 applications that received both a priority score and a percentile score during peer review. There were 357 new (Type 1) grants and 432 competing renewal (Type 2) grants, with a median direct cost of $195,000. The percentile scores for these applications ranged from 0.1 through 43.4, with 93% of the applications having scores lower than 20. Figure 1 shows the percentile score distribution.

Figure 1. Cumulative number of NIGMS R01 grants in Fiscal Year 2006 as a function of percentile score.

Figure 1. Cumulative number of NIGMS R01 grants in Fiscal Year 2006 as a function of percentile score.

These grants were linked (primarily by citation in publications) to a total of 6,554 publications that appeared between October 2006 and September 2010 (Fiscal Years 2007-2010). Those publications had been cited 79,295 times as of April 2011. The median number of publications per grant was 7, with an interquartile range of 4-11. The median number of citations per grant was 73, with an interquartile range of 26-156.

The numbers of publications and citations represent the simplest available metrics of productivity. More refined metrics include the number of research (as opposed to review) publications, the number of citations that are not self-citations, the number of citations corrected for typical time dependence (since more recent publications have not had as much time to be cited as older publications), and the number of highly cited publications (which I defined as the top 10% of all publications in a given set). Of course, the metrics are not independent of one another. Table 1 shows these metrics and the correlation coefficients between them.

Table 1. Correlation coefficients between nine metrics of productivity.

Table 1. Correlation coefficients between nine metrics of productivity.

How do these metrics relate to percentile scores? Figures 2-4 show three distributions.

Figure 2. Distribution of the number of publications as a function of percentile score. The inset shows a histogram of the number of grants as a function of the number of publications.

Figure 2. Distribution of the number of publications as a function of percentile score. The inset shows a histogram of the number of grants as a function of the number of publications.

Figure 3. Distribution of the number of citations as a function of percentile score. The inset shows a histogram of the number of grants as a function of the number of citations.

Figure 3. Distribution of the number of citations as a function of percentile score. The inset shows a histogram of the number of grants as a function of the number of citations.

Figure 4. Distribution of the number of highly cited publications as a function of percentile score. Highly cited publications are defined as those in the top 10% of all research publications in terms of the total number of citations corrected for the observed average time dependence of citations.

Figure 4. Distribution of the number of highly cited publications as a function of percentile score. Highly cited publications are defined as those in the top 10% of all research publications in terms of the total number of citations corrected for the observed average time dependence of citations.

As could be anticipated, there is substantial scatter across each distribution. However, as could also be anticipated, each of these metrics has a negative correlation coefficient with the percentile score, with higher productivity metrics corresponding to lower percentile scores, as shown in Table 2.

Table 2. Correlation coefficients between the grant percentile score and nine metrics of productivity.

Table 2. Correlation coefficients between the grant percentile score and nine metrics of productivity.

Do these distributions reflect statistically significant relationships? This can be addressed through the use of a Lorenz curve Link to external web site to plot the cumulative fraction of a given metric as a function of the cumulative fraction of grants, ordered by their percentile scores. Figure 5 shows the Lorentz curve for citations.

Figure 5. Cumulative fraction of citations as a function of the cumulative fraction of grants, ordered by percentile score. The shaded area is related to the excess fraction of citations associated with more highly rated grants.

Figure 5. Cumulative fraction of citations as a function of the cumulative fraction of grants, ordered by percentile score. The shaded area is related to the excess fraction of citations associated with more highly rated grants.

The tendency of the Lorenz curve to reflect a non-uniform distribution can be measured by the Gini coefficient Link to external web site. This corresponds to twice the shaded area in Figure 5. For citations, the Gini coefficient has a value of 0.096. Based on simulations, this coefficient is 3.5 standard deviations above that for a random distribution of citations as a function of percentile score. Thus, the relationship between citations and the percentile score for the distribution is highly statistically significant, even if the grant-to-grant variation within a narrow range of percentile scores is quite substantial. Table 3 shows the Gini coefficients for the all of the productivity metrics.

Table 3. Gini coefficients for nine metrics of productivity. The number of standard deviations above the mean, as determined by simulations, is shown in parentheses below each coefficient.

Table 3. Gini coefficients for nine metrics of productivity. The number of standard deviations above the mean, as determined by simulations, is shown in parentheses below each coefficient.

Of these metrics, overall citations show the most statistically significant Gini coefficient, whereas highly cited publications show one of the least significant Gini coefficients. As shown in Figure 4, the distribution of highly cited publications is relatively even across the entire percentile score range.

The Advisory Council’s Critical Roles

5 comments

Later this month, the National Advisory General Medical Sciences Council will hold the first of its three meetings in 2011. While many applicants, grantees and reviewers are familiar with the roles and processes of study sections, fewer know how an advisory council works. In this post, I’ll provide an overview of its many critical roles.

Council members are leaders in the biological and medical sciences, education, health care and public affairs. Their areas of expertise cover the broad range of scientific fields supported by NIGMS. The Council performs the second level of peer review for research and research training grant applications assigned to NIGMS. Council members also offer advice and recommendations on policy and program development, program implementation, evaluation and other matters of significance to the mission and goals of the Institute.

A portion of each Council meeting is open to the public.

For the peer review function, which occurs during the part of the meeting that is closed to the public, Council members read summary statements, providing a general check on the quality of the first level of peer review. They advise us if they find cases where the comments and scores do not appear to be in good alignment. Their evaluation complements the initial peer review done by study sections, as it focuses primarily on summary statements rather than on applications (although Council members may have access to the applications).

Members also provide advice regarding formal appeals, typically discussing 10-20 cases per meeting in which a procedural aspect may have significantly influenced the initial peer review process.

The Council also provides input on cases where staff are considering exceptions to the well-funded laboratory policy, and it approves the potential funding of grants to investigators at foreign institutions. Another area of Council input relates to Method to Extend Research in Time (MERIT) awards. Finally, Council members point out applications that they feel are particularly interesting based on their scientific expertise and knowledge of trends in particular fields. They explain their perspective to NIGMS staff, who incorporate this input in subsequent steps of the funding decision process. I’ll describe these steps in an upcoming post.

The policy and program advisory function includes discussing “concept clearances,” or ideas for new initiatives being considered within the Institute. These can take the form of proposed requests for applications (RFAs) or program announcements (PAs). Council members provide critical analysis and feedback about the appropriateness of proposed initiatives and factors to consider should they be implemented. Approved concept clearances are posted soon after each Council meeting on the NIGMS Web site and often on the Feedback Loop. NIGMS staff can then receive input from the scientific community as they refine the funding opportunity announcements.

This month’s meeting will include one concept clearance presentation, on macromolecular complexes.

Council members also give input and feedback on assessments and formal evaluations of specific NIGMS programs, such as the Protein Structure Initiative. When the need arises, Council members form working groups focused on specific issues. To ensure an appropriate range of expertise and perspectives, these groups can include non-Council members, as well. Finally, the Council receives periodic reports about ongoing initiatives in order to monitor how they are proceeding and offer advice about possible changes.

NIH-Wide Correlations Between Overall Impact Scores and Criterion Scores

5 comments

In a recent post, I presented correlations between the overall impact scores and the five individual criterion scores for sample sets of NIGMS applications. I also noted that the NIH Office of Extramural Research (OER) was performing similar analyses for applications across NIH.

OER’s Division of Information Services has now analyzed 32,608 applications (including research project grant, research center and SBIR/STTR applications) that were discussed and received overall impact scores during the October, January and May Council rounds in Fiscal Year 2010. Here are the results by institute and center:

Correlation coefficients between the overall impact score and the five criterion scores for 32,608 NIH applications from the Fiscal Year 2010 October, January and May Council rounds.

Correlation coefficients between the overall impact score and the five criterion scores for 32,608 NIH applications from the Fiscal Year 2010 October, January and May Council rounds. High-res. image (112KB JPG)

This analysis reveals the same trends in correlation coefficients observed in smaller data sets of NIGMS R01 grant applications. Furthermore, no significant differences were observed in the correlation coefficients among the 24 NIH institutes and centers with funding authority.

Scoring Analysis with Funding Status

15 comments

In response to a previous post, a reader requested a plot showing impact score versus percentile for applications for which funding decisions have been made. Below is a plot for 655 NIGMS R01 applications reviewed during the January 2010 Council round.

A plot of the overall impact score versus the percentile for 655 NIGMS R01 applications reviewed during the January 2010 Council round. Green circles show applications for which awards have been made. Black squares show applications for which awards have not been made.

A plot of the overall impact score versus the percentile for 655 NIGMS R01 applications reviewed during the January 2010 Council round. Green circles show applications for which awards have been made. Black squares show applications for which awards have not been made.

This plot confirms that the percentile representing the halfway point of the funding curve is slightly above the 20th percentile, as expected from previously posted data.

Notice that there is a small number of applications with percentile scores better than the 20th percentile for which awards have not been made. Most of these correspond to new (Type 1, not competing renewal) applications that are subject to the NIGMS Council’s funding decision guidelines for well-funded laboratories.

Impact Score Paragraph in Summary Statements, Plain Language in Public Sections of Grant Applications

0 comments

Extramural NexusThe August issue of NIH’s Extramural Nexus includes two announcements that might interest you.

Impact Score Paragraph in Summary Statements

Starting with September grant application reviews, reviewers will include a summary paragraph to explain what factors they considered in assigning the overall impact score. This should help investigators better understand the reasons for the score.

Plain Language in Public Sections of Grant Applications

The director’s column talks about the importance of communicating research value in your grant application.

Your grant title, abstract and statement of public health relevance are very important. Once a grant is funded, these items are available to the public through NIH’s RePORTER database. Many people are interested in learning about research supported with taxpayer dollars, so I encourage you to be clear and accurate in writing these parts of your application. Reviewers are being told to expect plain language in these sections.

The Nexus column includes links to these helpful resources: