
I recently posted several analyses (on July 15, July 19 and July 21) of the relationships between the overall impact scores on R01 applications determined by study sections and the criterion scores assigned by individual reviewers. These analyses were based on a sample of NIGMS applications reviewed during the October 2009 Council round. This was the first batch of applications for which criterion scores were used.
NIGMS applications for the October 2010 Council round have now been reviewed. Here I present my initial analyses of this data set, which consists of 654 R01 applications that were discussed, scored and percentiled.
The first analysis, shown below, relates to the correlation coefficients between the overall impact score and the averaged individual criterion scores.
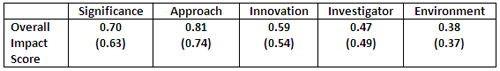
Overall, the trend in correlation coefficients is similar to that observed for the sample from 1 year ago, although the correlation coefficients for the current sample are slightly higher for four out of the five criterion scores.
Here are results from a principal component analysis:
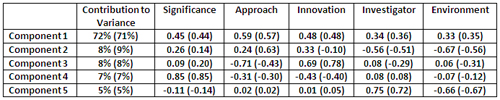
There is remarkable agreement between the results of the principal component analysis for the October 2010 data set and those for the October 2009 data set. The first principal component accounts for 72% of the variance, with the largest contribution coming from approach, followed by innovation, significance, investigator and finally environment. This agreement between the data sets extends through all five principal components, although there is somewhat more variation for principal components 2 and 3 than for the others.
Another important factor in making funding decisions is the percentile assigned to a given application. The percentile is a ranking that shows the relative position of each application’s score among all scores assigned by a study section at its last three meetings. Percentiles provide a way to compare applications reviewed by different study sections that may have different scoring behaviors. They also correct for “grade inflation” or “score creep” in the event that study sections assign better scores over time.
Here is a plot of percentiles and overall impact scores:

This plot reveals that a substantial range of overall impact scores can be assigned to a given percentile score. This phenomenon is not new; a comparable level of variation among study sections was seen in the previous scoring system, as well.
The correlation coefficient between the percentile and overall impact score in this data set is 0.93. The correlation coefficients between the percentile and the averaged individual criterion scores are given below:
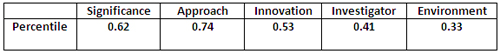
As one would anticipate, these correlation coefficients are somewhat lower than those for the overall impact score since the percentile takes other factors into account.
The results of a principal component analysis applied to the percentile data show:
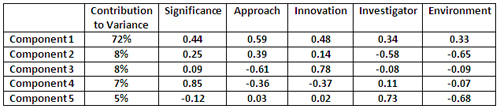
The results of this analysis are very similar to those for the overall impact scores, with the first principal component accounting for 72% of the variance and similar weights for the individual averaged criterion scores.
Our posting of these scoring analyses has led the NIH Office of Extramural Activities and individual institutes to launch their own analyses. I will share their results as they become available.
Jeremy, this is great stuff! You are commended for spearheading this effort at NIGMS and goading your colleagues at OER and the other ICs to perform the same analyses.
What would be truly fascinating would be to redo your impact score versus percentile scatter plot, coloring the dots for the funded grants green (like money!) and the dots for the unfunded grants brown.
Since these applications have not yet gone to our Advisory Council, none have been funded to date. It will take some time for funding decisions to be made and will depend on when the NIH appropriation for Fiscal Year 2011 is passed.
We just posted such an analysis of data from the January 2010 Council.
Jeremy,
Nice analysis.
Thanks for the interesting info.
Can you break it down by funding category: R01, SBIR Phase I, etc.
Thank you
The analysis presented is based only on R01 applications.
Fascinating. I was wondering whether the fact that your prior analysis was from the very first round of the new scoring would matter. Guess not. Interesting for the NIH to contemplate whether their attempts to shift reviewer focus onto the “Innovation” component is working, needs rethinking or perhaps even whether it ever *could* work.
Maybe you need to just totally clean house on the review panels in one fell swoop :-p.
Jeremy, I wonder if the lack of correlation with the Investigator category might be misleading. In my experience, reviewers will typically say nice things about a PI even while they are trashing a grant–they don’t want to make the PI feel bad. As far as official scoring goes, there may be much less variance in this number than in the other categories.
In their heads, of course, reviewers really do take the investigator into account. Thus, an established investigator, a leader in the field with a long history of productivity, will be given breaks that others are not given. The grant could be poorly written, the assumptions unjustified, the next experiments leaps unexplained, and the panel will often give the PI the benefit of the doubt, because they’ve produced in the past. This they would be less likely to do for a newer investigator. Of course it can go the other way too–a senior investigator with lots of funding can put in an application that might receive a good score were it from a junior investigator, but the panel might think “zheesh, they can do better than this, surely”, and score it more harshly.
I guess my point here is that in their black hearts, reviewers actually do give a lot of weight to who the PI is. This at least is my hypothesis. One way to test it is to look at the variance in the Investigator scores. I predict that it will be substantially lower than for the other categories, and that its average will be higher.
I guess a last thing to say is that one can be misled by analyses of scoring patterns. No doubt they are informative, but they don’t always reflect how reviewers are behaving. I wonder, for instance, if one changed simply the order of the criteria whether one wouldn’t get different results? Sometimes reviewers simply address the key points of their review in the first field they find. Moving “Innovation” up or down might influence its ultimate correlation.
Maybe others have had different experiences?
The strong correlation between impact and approach may reflect the unfortunate reality that a flawed approach can sink a great idea. The weak correlation for innovation may reflect the difficulty reviewers have with this criterion. Innovation is hard to define, and scored quite differently by different reviewers.
AR, I would suggest the “difficulty” reviewers have with the Innovation criterion is not confusion over what it really means. Rather it is *resistance* to the notion that Innovation should be more important than Approach and Significance. They just are not on board with this top-down emphasis of the NIH. So they strive to djinn up Innovation compliments for apps that are obviously lacking innovation because they like the approach and/or significance.
Really nice analysis. I’m delighted to see these posts, and actually see the numbers. I’m waiting with baited breath to see what will come out from the other institutes.
I was just at a meeting with someone who insisted that significance now is the most important criterion to getting funded. That seems clearly not to be the case in practice, at least in GM.
It would be helpful to do a test of the review objectivity. The only way I can think of testing something like that is to send an application that would contain the exact same science, but be reviewed by a different study section, and also to do a similar thing and in one case have a new investigator as the PI, while in another it would have someone with a long track record. Alternatively, an application could be sent to a study section in which the PI has been funded previously, and is known to the review group, and to a different study section where s/he would be considered a “newcomer.” It would be interesting to see what would happen to that grant under these different conditions. I am quite certain that the results would be both interesting and informative.