Month: June 2011

Connecting at Lindau

0 comments

Greetings from Lindau, Germany, where I and my NIH colleagues, Irene Eckstrand and Katrin Eichelberg, are attending the 61st Lindau Nobel Laureate Meeting Link to external web site. This year’s meeting, focused on physiology and medicine, has brought together 23 Nobel laureates and 566 outstanding pre- and postdoctoral students, including 80 from the United States, to share their passion for science and their commitment to finding solutions to the world’s biggest problems.

Video remarks from NIH Director Francis Collins at the Lindau meeting. 

Video remarks from NIH Director Francis Collins at the Lindau meeting.

This is the third year that NIGMS has participated in the Lindau program, and the first year in which participation was NIH-wide.

Each morning, six Nobel laureates have given short lectures about the history of their science, their successes and failures, and their visions of the future. Among the NIGMS-funded laureates giving these talks are Elizabeth Blackburn, Oliver Smithies, Thomas Steitz, Roger Tsien and Ada Yonath. The afternoons are reserved for free-ranging discussions among the laureates and young researchers. It has been a delight to watch the two groups get to know each other and discuss important scientific problems of global interest and importance.

On the opening day, Countess Bettina Bernadotte, whose family has sponsored the meeting since its beginning, welcomed the assembly. Her enthusiasm for science and her commitment to the meetings was apparent in her introduction of the Lindau mission – “Educate. Inspire. Connect” – and her advice that we “never cease to be curious.” Expanding on this, Annette Schavan, the German Federal Minister of Education and Research, stressed that connections among the generations, such as those made at this meeting, are crucial to scientific progress.

The American delegation, which was sponsored by NIH, the Department of Energy, Oak Ridge Associated Universities and Mars Incorporated, organized a U.S.-themed International Day on Monday, June 27. This series of events truly jumpstarted the week.

As part of International Day, NIH-supported Nobel laureate Peter Agre explained his view of the scientist-citizen who uses his or her knowledge and talents to make the world a better place. The discoverer of aquaporins, Agre talked about applying his research to fighting malaria in Zambia. NIGMS’ Irene Eckstrand then spoke about using the power of computing to inform policies for the control and eradication of infectious diseases. An energetic discussion ensued between the highly engaged students and speakers, focusing on efforts to understand the epidemiology of malaria, approaches to reducing the number of deaths from the disease and the importance of collaborative research between developed and developing nations.

The International Day evening program included a very well-received video address from NIH Director Francis Collins on the strength of American medical science. His message about NIH’s commitment to global health aligned perfectly with the focus of earlier talks, including a presentation by Bill Gates, who was inducted into the Honorary Senate of the Lindau Foundation.

Irene, Katrin and I are all quite proud to have been a part of this effort and look forward to sharing more about our experiences here.

Post written by Donna Krasnewich, Irene Eckstrand and Katrin Eichelberg (NIAID)

NIGMS Cell Repository Now Includes iPS Cell Lines

0 comments

The HGCR iPS cell lines undergo extensive characterization, including assessment of their capacity to differentiate into specialized cell types. The cell shown here was directed to differentiate into a nerve cell.As we anticipated last year, the NIGMS Human Genetic Cell Repository Link to external web site (HGCR) now offers human induced pluripotent stem cell lines that carry disease gene mutations. The first five lines to be made available were derived from individuals with Huntington’s disease, juvenile onset diabetes, severe combined immunodeficiency disease, muscular dystrophy and spinal muscular atrophy. The repository is developing more cell lines representing other diseases.

The iPS cell lines Link to external web site, along with more than 10,000 others in the repository, are comprehensively characterized to ensure their identity, stability and purity. This quality control makes the repository an excellent resource for researchers who need well-characterized, disease-specific cells.

You can order any of the repository’s cell lines via the HGCR catalog Link to external web site.

At the Interface of Evolution and Medicine

0 comments

At last week’s Evolution and Medicine Symposium (link no longer available) at the Evolution 2011 meeting in Norman, Oklahoma, experts from around the country came together to discuss how evolutionary biology is influencing our understanding of human health and disease.

At the meeting, I talked about NIGMS’s commitment to funding research on the principles and dynamics of evolution and highlighted the importance of studying biological systems, such as infectious diseases and physiology, in their evolutionary context.

In preparing my remarks, I realized that the work of clinicians and evolutionary biologists could be highly synergistic. M.D.s know a great deal about individual variation and clinical presentation, while evolutionary biologists have a good grasp of variation at the population level. Both of these perspectives are very valuable to the field of personalized medicine, for example. The question now is: How do we create an opportunity for these two groups to work with each other?

The meeting featured many interesting talks, including:

  • Dyann Wirth of the Harvard School of Public Health explained that in the very near future we will have enough sequence data from Plasmodium, mosquitoes and humans to understand regional variation as well as co-evolution of the malaria pathogen and its hosts. We should be able to use this information to build computational models and evaluate intervention, eradication and elimination strategies. Wirth said these capabilities stem from advances in DNA sequencing technologies that are having a revolutionary effect on evolution research, including evolution and medicine.
  • Carl Bergstrom of the University of Washington spoke on the integration of mathematical modeling and evolution. He gave a real example of how to use antiviral drugs most effectively in an influenza outbreak. The question was how to deploy antivirals to reduce the likelihood of resistance and minimize illness and death. Bergstrom said that the answer is non-obvious unless you understand how phylogenies work and know a little bit of math.
  • Angela Hancock of the University of Chicago talked about recent data showing that human genetic variation that’s adaptive in one context will not be so in other contexts. Studying 61 populations from different parts of the world, she identified signals of selection in a variety of genes related to UV radiation, infection and immunity, and cancer.

This symposium came at the perfect time to describe two new NIGMS-related efforts. We previewed an NIH high school curriculum supplement on evolution and medicine that will be released this fall. Also, in conjunction with the National Science Foundation and the U.S. Department of Agriculture, we will be announcing later this summer a call for applications to study dynamic biological systems in their ecological and evolutionary contexts. I’ll share more details about these efforts in the near future.

Acting Director Named

0 comments

Photo of Dr. Judith Greenberg
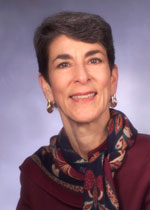
As I enter my final few weeks at NIGMS, I’m engaged in a lot of transition planning. One major aspect is the designation of an acting director, and I’m happy to tell you that Judith Greenberg has agreed to serve in this capacity after my departure early next month. She was acting director in 2002 and 2003, after Marvin Cassman left and before I arrived, and I know that she will once again do a fantastic job.

For more about Judith, see the news release we just issued.


Productivity Metrics and Peer Review Scores, Continued

11 comments

In a previous post, I described some initial results from an analysis of the relationships between a range of productivity metrics and peer review scores. The analysis revealed that these productivity metrics do correlate to some extent with peer review scores but that substantial variation occurs across the population of grants.

Here, I explore these relationships in more detail. To facilitate this analysis, I separated the awards into new (Type 1) and competing renewal (Type 2) grants. Some parameters for these two classes are shown in Table 1.

Table 1. Selected=

Table 1. Selected parameters for the population of Type 1 (new) and Type 2 (competing renewal) grants funded in Fiscal Year 2006: average numbers of publications, citations and highly cited citations (defined as those being in the top 10% of time-corrected citations for all research publications).

For context, the Fiscal Year 2006 success rate was 26%, and the midpoint on the funding curve was near the 20th percentile.

To better visualize trends in the productivity metrics data in light of the large amounts of variability, I calculated running averages over sets of 100 grants separately for the Type 1 and Type 2 groups of grants, shown in Figures 1-3 below.

Figure 1. Running averages for the number of publications over sets of 100 grants funded in Fiscal Year 2006 for Type 1 (new, solid line) and Type 2 (competing renewal, dotted line) grants as a function of the average percentile for that set of 100 grants.

Figure 1. Running averages for the number of publications over sets of 100 grants funded in Fiscal Year 2006 for Type 1 (new, solid line) and Type 2 (competing renewal, dotted line) grants as a function of the average percentile for that set of 100 grants.

Figure 2. Running averages for the number of citations over sets of 100 grants funded in Fiscal Year 2006 for Type 1 (new, solid line) and Type 2 (competing renewal, dotted line) grants as a function of the average percentile for that set of 100 grants.

Figure 2. Running averages for the number of citations over sets of 100 grants funded in Fiscal Year 2006 for Type 1 (new, solid line) and Type 2 (competing renewal, dotted line) grants as a function of the average percentile for that set of 100 grants.

Figure 3. Running averages for the number of highly cited publications over sets of 100 grants funded in Fiscal Year 2006 for Type 1 (new, solid line) and Type 2 (competing renewal, dotted line) grants as a function of the average percentile for that set of 100 grants.

Figure 3. Running averages for the number of highly cited publications over sets of 100 grants funded in Fiscal Year 2006 for Type 1 (new, solid line) and Type 2 (competing renewal, dotted line) grants as a function of the average percentile for that set of 100 grants.

These graphs show somewhat different behavior for Type 1 and Type 2 grants. For Type 1 grants, the curves are relatively flat, with a small decrease in each metric from the lowest (best) percentile scores that reaches a minimum near the 12th percentile and then increases somewhat. For Type 2 grants, the curves are steeper and somewhat more monotonic.

Note that the curves for the number of highly cited publications for Type 1 and Type 2 grants are nearly superimposable above the 7th percentile. If this metric truly reflects high scientific impact, then the observations that new grants are comparable to competing renewals and that the level of highly cited publications extends through the full range of percentile scores reinforce the need to continue to support new ideas and new investigators.

While these graphs shed light on some of the underlying trends in the productivity metrics and the large amount of variability that is observed, one should be appropriately cautious in interpreting these data given the imperfections in the metrics; the fact that the data reflect only a single year; and the many legitimate sources of variability, such as differences between fields and publishing styles.

More on Assessing the Glue Grant Program

0 comments

NIGMS is committed to thoughtful analysis before it initiates new programs and to careful, transparent assessment of ongoing programs at appropriate stages to help determine future directions. In this spirit, we have been assessing our large-scale programs, starting with the Protein Structure Initiative and more recently, the glue grant program.

For the glue grants (which are formally known as Large-Scale Collaborative Project Awards), we engaged in both a process evaluation and an outcomes assessment. These assessments, conducted by independent, well-qualified groups, articulated the strengths and accomplishments, as well as the weaknesses and challenges, of the glue grant program. The main conclusion of the outcomes assessment was that NIGMS should discontinue the current program and in its place create “a suite of modified program(s) to support innovative, interdisciplinary, large scale research” with the recommendation “that awards should be considerably smaller, but larger in number.”

The glue grant program was developed beginning in 1998 in anticipation of substantial increases in the NIH budget. At that time, members of the scientific community were expressing concern about how to support a trend toward interdisciplinary and collaborative science. This was discussed extensively by our Advisory Council. Here’s an excerpt from the minutes of a January 1999 meeting:

“Council discussion centered on why current mechanisms do not satisfy the need; the fact that these will be experiments in the organization of integrative science; the usefulness of consortia in collecting reference data and developing new technology that are difficult to justify on individual projects; the need to include international collaborations; and the need for rapid and open data sharing. Council voted concurrence with NIGMS plans to further develop and issue these initiatives.”

This summary captures many of the key challenges that emerged over the next 12 years in the glue grant program. I’d like to give my perspective on three key points.

First, these grants were always intended to be experiments in the organization of integrative science. One of the most striking features of the glue grants is how different they are from one another based on the scientific challenge being addressed, the nature of the scientific community in which each glue grant is embedded and the approach of the principal investigator and other members of the leadership team. The process evaluation expressed major concern about such differences between the glue grants, but in fact this diversity reflects a core principle of NIGMS: a deep appreciation for the role of the scientific community in defining scientific problems and identifying approaches for addressing them.

Second, as highlighted in both reports, the need for rapid and open data sharing remains a great challenge. All of the glue grants have included substantial investments in information technology and have developed open policies toward data release. However, making data available and successfully sharing data in forms that the scientific community will embrace are not equivalent. And of course, effective data and knowledge sharing is a challenge throughout the scientific community, not just in the glue grants.

Third, the timing for these assessments is challenging. On one hand, it is desirable to perform the assessments as early as possible after the initiation of a new program to inform program management and to indicate the need for potential adjustments.  On the other hand, the impact of scientific advances takes time to unfold and this can be particularly true for ambitious, larger-scale programs. It may be interesting to look at the impact of these programs again in the future to gauge their impact over time.

During my time at NIGMS, I have been impressed by the considerable efforts of the Institute staff involved with the glue grants. They have approached the stewardship of this novel program with a critical eye, working to find oversight mechanisms that would facilitate the impact of the grants on the relevant, broad components of the scientific community. As the current program ends, we will continue to think creatively about how best to support collaborative research, bearing in mind the glue grant assessment panel’s recommendation that we explore appropriate mechanisms to support large-scale, collaborative approaches.

Early Notice: Reissue of RFA for Centers for AIDS-Related Structural Biology

0 comments

For 25 years, NIGMS has supported AIDS-related structural biology research that has provided fundamental insights into the replication of HIV and contributed toward the development of essential therapeutics.

As Joe Gindhart discussed in an earlier Feedback Loop post, NIGMS marked the anniversary of this program with a special meeting in March. Many participants expressed excitement and offered overwhelmingly positive feedback about the program, in particular the progress and achievements reported from the three P50 Centers for the Determination of Structures of HIV/Host Complexes: Center for the Structural Biology of Cellular Host Elements in Egress, Trafficking and Assembly of HIV, HIV Accessory and Regulatory Complexes and Center for HIV Protein Interactions.

HIV RFA

Following endorsement by our Advisory Council at its meeting last month, we plan to reissue the centers RFA this summer. The new RFA will encompass the goals of the previous one, but will be broadened to include RNA/protein and membrane/protein interactions and a push to move beyond static structures to characterize the dynamics of complexes as a way to improve future drug design. This reissued RFA will also include a new requirement for a collaborative development program intended to recruit skilled investigators, especially early stage investigators, into AIDS-related structural biology research. We expect to fund four or five centers for a 5-year period.

I will post more information about this funding opportunity once it has been published in the NIH Guide.

Productivity Metrics and Peer Review Scores

18 comments

A key question regarding the NIH peer review system relates to how well peer review scores predict subsequent scientific output. Answering this question is a challenge, of course, since meaningful scientific output is difficult to measure and evolves over time–in some cases, a long time. However, by linking application peer review scores to publications citing support from the funded grants, it is possible to perform some relevant analyses.

The analysis I discuss below reveals that peer review scores do predict trends in productivity in a manner that is statistically different from random ordering. That said, there is a substantial level of variation in productivity metrics among grants with similar peer review scores and, indeed, across the full distribution of funded grants.

I analyzed 789 R01 grants that NIGMS competitively funded during Fiscal Year 2006. This pool represents all funded R01 applications that received both a priority score and a percentile score during peer review. There were 357 new (Type 1) grants and 432 competing renewal (Type 2) grants, with a median direct cost of $195,000. The percentile scores for these applications ranged from 0.1 through 43.4, with 93% of the applications having scores lower than 20. Figure 1 shows the percentile score distribution.

Figure 1. Cumulative number of NIGMS R01 grants in Fiscal Year 2006 as a function of percentile score.

Figure 1. Cumulative number of NIGMS R01 grants in Fiscal Year 2006 as a function of percentile score.

These grants were linked (primarily by citation in publications) to a total of 6,554 publications that appeared between October 2006 and September 2010 (Fiscal Years 2007-2010). Those publications had been cited 79,295 times as of April 2011. The median number of publications per grant was 7, with an interquartile range of 4-11. The median number of citations per grant was 73, with an interquartile range of 26-156.

The numbers of publications and citations represent the simplest available metrics of productivity. More refined metrics include the number of research (as opposed to review) publications, the number of citations that are not self-citations, the number of citations corrected for typical time dependence (since more recent publications have not had as much time to be cited as older publications), and the number of highly cited publications (which I defined as the top 10% of all publications in a given set). Of course, the metrics are not independent of one another. Table 1 shows these metrics and the correlation coefficients between them.

Table 1. Correlation coefficients between nine metrics of productivity.

Table 1. Correlation coefficients between nine metrics of productivity.

How do these metrics relate to percentile scores? Figures 2-4 show three distributions.

Figure 2. Distribution of the number of publications as a function of percentile score. The inset shows a histogram of the number of grants as a function of the number of publications.

Figure 2. Distribution of the number of publications as a function of percentile score. The inset shows a histogram of the number of grants as a function of the number of publications.

Figure 3. Distribution of the number of citations as a function of percentile score. The inset shows a histogram of the number of grants as a function of the number of citations.

Figure 3. Distribution of the number of citations as a function of percentile score. The inset shows a histogram of the number of grants as a function of the number of citations.

Figure 4. Distribution of the number of highly cited publications as a function of percentile score. Highly cited publications are defined as those in the top 10% of all research publications in terms of the total number of citations corrected for the observed average time dependence of citations.

Figure 4. Distribution of the number of highly cited publications as a function of percentile score. Highly cited publications are defined as those in the top 10% of all research publications in terms of the total number of citations corrected for the observed average time dependence of citations.

As could be anticipated, there is substantial scatter across each distribution. However, as could also be anticipated, each of these metrics has a negative correlation coefficient with the percentile score, with higher productivity metrics corresponding to lower percentile scores, as shown in Table 2.

Table 2. Correlation coefficients between the grant percentile score and nine metrics of productivity.

Table 2. Correlation coefficients between the grant percentile score and nine metrics of productivity.

Do these distributions reflect statistically significant relationships? This can be addressed through the use of a Lorenz curve Link to external web site to plot the cumulative fraction of a given metric as a function of the cumulative fraction of grants, ordered by their percentile scores. Figure 5 shows the Lorentz curve for citations.

Figure 5. Cumulative fraction of citations as a function of the cumulative fraction of grants, ordered by percentile score. The shaded area is related to the excess fraction of citations associated with more highly rated grants.

Figure 5. Cumulative fraction of citations as a function of the cumulative fraction of grants, ordered by percentile score. The shaded area is related to the excess fraction of citations associated with more highly rated grants.

The tendency of the Lorenz curve to reflect a non-uniform distribution can be measured by the Gini coefficient Link to external web site. This corresponds to twice the shaded area in Figure 5. For citations, the Gini coefficient has a value of 0.096. Based on simulations, this coefficient is 3.5 standard deviations above that for a random distribution of citations as a function of percentile score. Thus, the relationship between citations and the percentile score for the distribution is highly statistically significant, even if the grant-to-grant variation within a narrow range of percentile scores is quite substantial. Table 3 shows the Gini coefficients for the all of the productivity metrics.

Table 3. Gini coefficients for nine metrics of productivity. The number of standard deviations above the mean, as determined by simulations, is shown in parentheses below each coefficient.

Table 3. Gini coefficients for nine metrics of productivity. The number of standard deviations above the mean, as determined by simulations, is shown in parentheses below each coefficient.

Of these metrics, overall citations show the most statistically significant Gini coefficient, whereas highly cited publications show one of the least significant Gini coefficients. As shown in Figure 4, the distribution of highly cited publications is relatively even across the entire percentile score range.

Resubmissions: More Time for New Investigators, General Clarification

1 comment

There is now a shortened review cycle for applications from new investigators. To give these applicants more time to prepare resubmissions (A1) between review cycles, NIH will accelerate the release of summary statements for the initial applications (A0). It has also pushed back the special submission date for new investigators to give them at least 30 days to prepare the revised application. Please refer to NOT-OD-11-057 for more details.

While we’re on this topic, I’d like to clear up confusion about when to submit a new application versus a resubmission. New applications and resubmissions typically differ in several important aspects (due date, introduction, etc.). For most funding opportunity announcements (FOAs), deciding whether to prepare a new submission (A0) or a resubmission (A1) is straightforward. But sometimes it’s not!

Here’s a little clarification. All applications in response to a request for applications (RFA) are considered new, unless the RFA says that applications to previous versions of the RFA may be submitted as resubmissions. For example, if NIGMS has issued an RFA and then decides to continue it via a non-RFA FOA, all applications to the FOA must be new the first time they are submitted. Similarly, if a PI continues an awarded U series application as an R series application (e.g., U01 to R01 after the original U01 FOA expired), then the R series application must be new.

Finally, applications to continue work started in a special Recovery Act activity code (RC1, RC2, RC3, RC4, etc.) should be submitted as new applications. Recovery Act competitive revision (S1) applications that were submitted to an existing FOA are an exception. They must be submitted as resubmissions (S1A1) and are subject to the NIH resubmission limit policy.

For those of you interested in a broader discussion of resubmissions, see the “Early Data on the A2 Sunset” blog post from OER director Sally Rockey.

Moving Cell Migration Forward: Meeting Highlights Progress

0 comments

Frontiers in Cell Migration and Mechanotransduction meeting poster
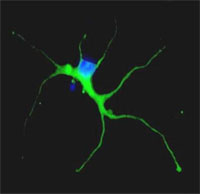
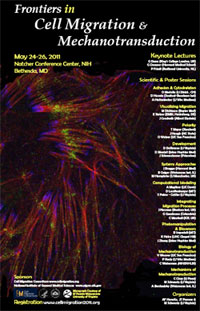
Last week, NIGMS hosted the Frontiers in Cell Migration and Mechanotransduction meeting. It brought together an impressive group of scientists working at many levels, from molecules to cells, tissues and organs.

The overall sense from the meeting is that a wide variety of tools, approaches and even fields have converged on this topic of how and why cells move and that this convergence has become a source of collaboration between communities that historically have not interacted.

Several important themes emerged, including:

  • Events, such as cell signaling, are highly localized and closely coordinated. In a fascinating talk, Klaus Hahn (University of North Carolina, Chapel Hill) presented new experimental data using a photoactivable and completely reversible probe that he developed for RhoG. Important in wound healing, RhoG turns on immediately at the leading edge when the cell moves and seems to regulate the direction of cell migration and whether a cell can turn.
  • It’s all about forces—once invisible to most techniques that biologists have used, forces are now being deduced and measured internally. Chris Chen (University of Pennsylvania) showed us a stem cell’s response to the dish surface generates cellular forces and that these forces affect whether the cell rounds up or spreads. Chen’s data suggests that cell spreading is essential for triggering distinct differentiation pathways—and that whether a stem cell becomes a brain or a bone cell is driven by this contractility.
  • Cells communicate and influence each other. In a talk that linked basic biology to clinical research, Anna Huttenlocher (University of Wisconsin-Madison) showed that leukocyte migration can be an immune response to cell wounding. By using photo-caged biosensors developed by Klaus Hahn, she found that neutrophil cells are more active and recruited more quickly after subsequent wounding events. They also recruit other cells to the wound sites.

The talks, as well as the poster session, pointed to additional conclusions: Cell migration is a collective behavior, and feedback mechanisms control many cell migration events.

This was the third and final meeting organized by the NIGMS-funded Cell Migration Consortium (CMC), whose project will sunset in August 2011. The consortium developed a cell migration gateway that will continue to exist as a resource for updates in the field; you can subscribe at http://cellmigration.org/cmg_update/ealert/signup.shtml (no longer available).

Jim Deatherage contributed to this post.