
The successful entry and retention of new investigators into biomedical research is a priority for us, and the renewal rate of this group’s first R01 research grants is an important indicator for this goal. Here are the results of an analysis I did of the first competing renewal rates for new and established investigators.
Figure 1 shows that the first competing renewal rate of new investigators’ first NIGMS R01 or R29 grants has declined over the past 10 years. This trend is similar to the one for overall NIGMS R01 application success rates.
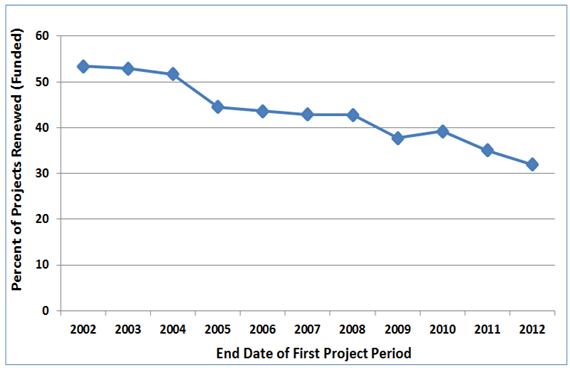
Figure 2 gives a more complete picture of the renewal history of new investigators’ NIGMS R01 and R29 projects. In addition to the renewal rate (also shown in Figure 1), it shows the percentage of projects for which at least one renewal application was submitted but was not successfully renewed as well as the percentage of projects for which no renewal application was submitted.
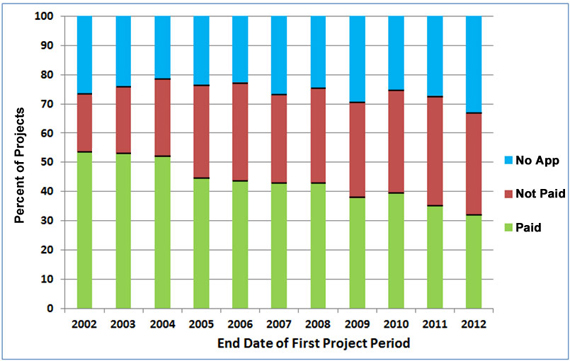
Figure 3 shows that success in renewing an NIGMS-funded R01 grant correlates positively with how long the grant has been active.
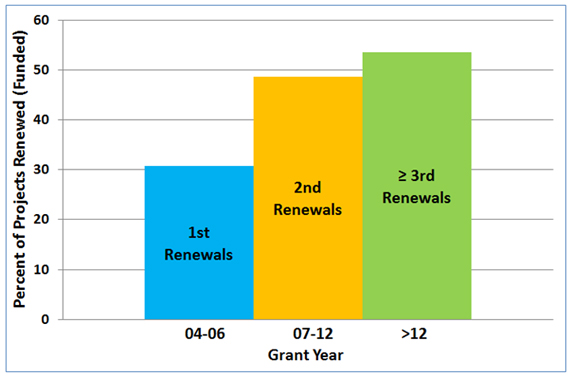
Since first renewals have lower success rates than subsequent renewals, Figure 4 addresses whether new investigators seeking to renew their first R01 grants are competitive with established investigators who are renewing long-term and/or new projects. The figure shows that the renewal rate for all projects from established investigators, including new as well as long-term projects, is higher than the renewal rate of projects from new investigators (46 percent in the left column versus 36 percent in the right column). However, when focusing only on the first renewals of new projects (in the middle and right columns), new investigators are renewing at a higher rate than are established investigators (36 percent versus 30 percent).
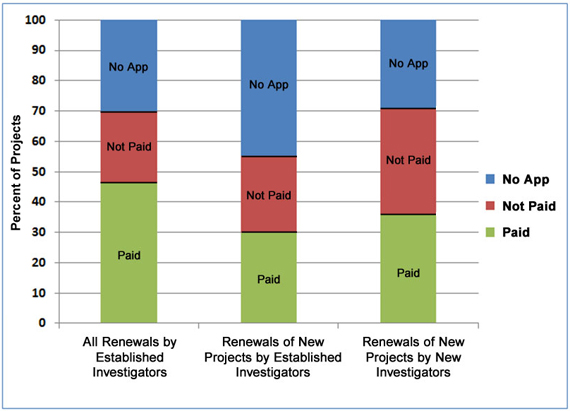
Figure 5 shows the relative success of new and established investigators in renewing new projects as a function of the percentile score obtained on the initial award. As the “Paid” sections of the bars indicate, for each of the percentile groups, the overall renewal rate for new investigators’ new R01s was higher than that for established investigators’ new R01s.
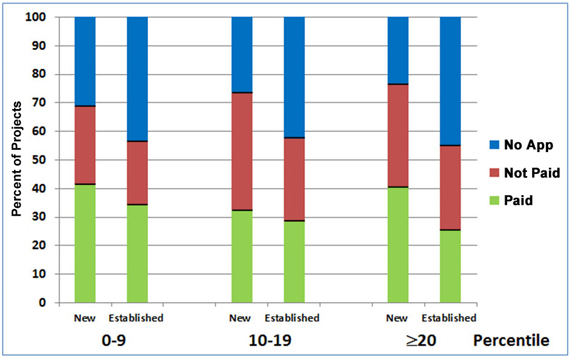
Recognizing the importance of new investigators in sustaining the vitality of biomedical research, we give special consideration to applications from them, and in some cases, we fund these applications at percentiles beyond those for most established investigators. The data in Figure 5 supports this practice by showing that the renewal rates of new investigators whose original applications scored at or above the 20th percentile are about the same as, or higher than, those for new and established investigators whose original applications scored in the 0-9th percentile range.
More About This Analysis
This analysis includes Recovery Act projects and excludes withdrawn applications and multi-principal investigator grants.
Definitions
R01 projects: Research project grants.
R29 projects: First Independent Research Support and Transition (FIRST) awards, R01-type research project grants awarded to new investigators available from 1987 to 1998.
Renewal rate: Percentage of grants that were successfully renewed by the date of this analysis (end of Fiscal Year 2014), regardless of whether a new or amended competing renewal application was funded.
Grant year: Grant year in which the renewal R01 application was submitted.
New investigator: An individual who has not previously competed successfully as a program director/principal investigator for a substantial NIH independent research award (see http://grants.nih.gov/grants/glossary.htm#NewInvestigator).
I have a query, not a comment. What about the success rate for individuals above the age of 70? Do you have any information in this regard?
I would be interested in the data for Figure 5 if they were broken down by whether the grant in question were the only grant for the lab in question. It seems as if looking at new projects from established investigators, there may be bias in that group for second and third funded projects for “new”.
It would be very interesting to correlate these numbers with productivity; i.e. how many publications per year for each group – successful renewal, non-successful renewal, and did not re-compete. When I was at the Program analysis branch at NIEHS (1999-2008) we did such an analysis of new investigator and it was found in the two cohorts we examined only about 50% tried to re-compete, and those that were successful published 2-3 papers per year for the four years leading up to the competitive renewal. Those that were not successful had a lower overall productivity.
The number of publications is NOT the same as productivity.
Some fields are more amenable to publishing zillions of dinky papers and mini-reviews with nearly the same title than others. I consider that litter, not productivity.
Are there data on how many of the new investigators were women and minorities and how that would overlay on Figure 1?
The analysis from Fig. 4 suggesting that new investigators are more successful at renewing grants, as compared to the renewal of new projects by established investigators, is misleading because a larger fraction of established investigators do not apply for a renewal. If we adjust for the no-shows, it becomes clear that experienced investigators are not only more successful at renewing long-term funded projects, but also new projects.
I disagree with the conclusion drawn from Fig 4; when focusing only on the first renewals of new projects (in the middle and right columns), new investigators are renewing at a higher rate than are established investigators (36 percent versus 30 percent). The suggestion being that new investigators are at least as competitive if not more so than established investigators.
Both Fig 4 and 5 clearly illustrate that established investigators attempt to renew awards at a lower rate than new investigators, and have greater success in renewing these awards. new investigators are more likely to attempt a renewal, and are less successful in such attempts.
The trend suggested by Figs 1 and 2 hold that new investigators are becoming progressively less successful. The suggestion being that new investigators are increasingly disadvantaged and/or established investigators are favored in the 10 year period that has also seen reduced paylines.
Unclear in this analysis would be if the trend is produced by an increase in the number of new investigators, leading to greater competition for the limited resources, rather than a shift in the relative advantage of established investigators.
We recognize that the success rate for established investigators who submit renewal applications for new projects is higher than that for new investigators, and this is an issue that concerns us. Here, we were focusing on the overall renewal rate for new projects. A new project that is not renewed for any reason is less likely to have been successful than one that was renewed, and thus this information is important in thinking about how we can make the best investments of our funds. We are planning to analyze the output of new projects that were not submitted for renewal versus those that were, as suggested by several commenters, to attempt to understand what the higher fraction of established investigators not submitting new grants for renewal indicates.
Is this data for all of the institutes and if not then are the findings similar across institutes?