Author: Jeremy Berg

Headshot of Jeremy Berg.

As former NIGMS director, Jeremy oversaw the Institute’s programs to fund biomedical research and to train the next generation of scientists. He was a leader in many NIH-wide activities and also found time to study a variety of molecular recognition processes in his NIH lab.

Posts by Jeremy Berg

Farewell

3 comments

Today is my last day as Director of NIGMS. It is hard to believe that almost 8 years have passed since I was first offered this tremendous opportunity to serve the scientific community. It has been a privilege to work with the outstanding staff members at NIGMS and NIH, as well as with so many of you across the country.

As I write my final post, I find myself recalling a statement I heard from then-NIH Director Elias Zerhouni during my first few years here: It is very difficult to translate that which you do not understand. He made this comment in the context of discussions about the balance between basic and applied research, which certainly has applicability in this setting and is relevant in a broader context as well. In some ways, it has also been my mantra for the NIGMS Feedback Loop.

Early in my time at NIH, I was struck by how often even relatively well-informed members of the scientific community did not understand the underlying bases for NIH policies and trends. Information voids were often filled with rumors that were sometimes very far removed from reality. The desire to provide useful information to the scientific community motivated me and others at NIGMS to start the Feedback Loop, first as an electronic newsletter and, for the past 2 years, as a blog. Our goal was–and is–to provide information and data that members of the scientific community can use to take maximal advantage of the opportunities provided across NIH and to understand the rationales behind long-standing and more recent NIH policies and initiatives.

I chose the name Feedback Loop with the hope that this venue would provide more than just a vehicle for pushing out information. I wanted it to promote two-way communication, with members of the scientific community feeling comfortable sharing their thoughts about the material presented or about other issues of interest to them. In biology, feedback loops serve as important regulatory mechanisms that allow systems to adjust to changes in their environments. I hoped that NIGMS’ “feedback loop” would serve a similar role.

I am pleased with our progress toward this goal, but there is considerable room for further evolution. The emergence and success of similar blogs such as Rock Talk are encouraging signs. I know that NIGMS Acting Director Judith Greenberg shares my enthusiasm for communication with the community, and I hope that the new NIGMS Director will too. I encourage you to continue to play your part, participate in the discussions and engage in the sort of dialogue that will best serve the scientific community.

I plan to continue communicating with many of you in my new position as a member of the extramural scientific community. For the time being, you can reach me at jeremybergtemp@gmail.com.

Acting Director Named

0 comments

Photo of Dr. Judith GreenbergAs I enter my final few weeks at NIGMS, I’m engaged in a lot of transition planning. One major aspect is the designation of an acting director, and I’m happy to tell you that Judith Greenberg has agreed to serve in this capacity after my departure early next month. She was acting director in 2002 and 2003, after Marvin Cassman left and before I arrived, and I know that she will once again do a fantastic job.

For more about Judith, see the news release we just issued.


Productivity Metrics and Peer Review Scores, Continued

11 comments

In a previous post, I described some initial results from an analysis of the relationships between a range of productivity metrics and peer review scores. The analysis revealed that these productivity metrics do correlate to some extent with peer review scores but that substantial variation occurs across the population of grants.

Here, I explore these relationships in more detail. To facilitate this analysis, I separated the awards into new (Type 1) and competing renewal (Type 2) grants. Some parameters for these two classes are shown in Table 1.

Table 1. Selected=

Table 1. Selected parameters for the population of Type 1 (new) and Type 2 (competing renewal) grants funded in Fiscal Year 2006: average numbers of publications, citations and highly cited citations (defined as those being in the top 10% of time-corrected citations for all research publications).

For context, the Fiscal Year 2006 success rate was 26%, and the midpoint on the funding curve was near the 20th percentile.

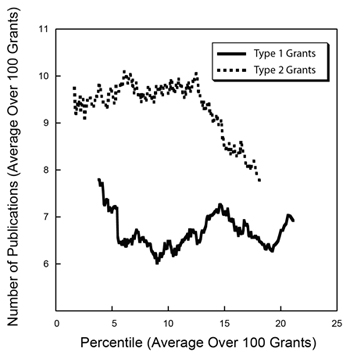
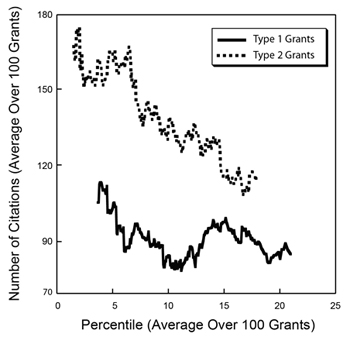
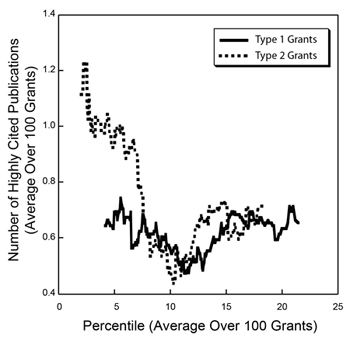
To better visualize trends in the productivity metrics data in light of the large amounts of variability, I calculated running averages over sets of 100 grants separately for the Type 1 and Type 2 groups of grants, shown in Figures 1-3 below.

Figure 1. Running averages for the number of publications over sets of 100 grants funded in Fiscal Year 2006 for Type 1 (new, solid line) and Type 2 (competing renewal, dotted line) grants as a function of the average percentile for that set of 100 grants.

Figure 1. Running averages for the number of publications over sets of 100 grants funded in Fiscal Year 2006 for Type 1 (new, solid line) and Type 2 (competing renewal, dotted line) grants as a function of the average percentile for that set of 100 grants.

Figure 2. Running averages for the number of citations over sets of 100 grants funded in Fiscal Year 2006 for Type 1 (new, solid line) and Type 2 (competing renewal, dotted line) grants as a function of the average percentile for that set of 100 grants.

Figure 2. Running averages for the number of citations over sets of 100 grants funded in Fiscal Year 2006 for Type 1 (new, solid line) and Type 2 (competing renewal, dotted line) grants as a function of the average percentile for that set of 100 grants.

Figure 3. Running averages for the number of highly cited publications over sets of 100 grants funded in Fiscal Year 2006 for Type 1 (new, solid line) and Type 2 (competing renewal, dotted line) grants as a function of the average percentile for that set of 100 grants.

Figure 3. Running averages for the number of highly cited publications over sets of 100 grants funded in Fiscal Year 2006 for Type 1 (new, solid line) and Type 2 (competing renewal, dotted line) grants as a function of the average percentile for that set of 100 grants.

These graphs show somewhat different behavior for Type 1 and Type 2 grants. For Type 1 grants, the curves are relatively flat, with a small decrease in each metric from the lowest (best) percentile scores that reaches a minimum near the 12th percentile and then increases somewhat. For Type 2 grants, the curves are steeper and somewhat more monotonic.

Note that the curves for the number of highly cited publications for Type 1 and Type 2 grants are nearly superimposable above the 7th percentile. If this metric truly reflects high scientific impact, then the observations that new grants are comparable to competing renewals and that the level of highly cited publications extends through the full range of percentile scores reinforce the need to continue to support new ideas and new investigators.

While these graphs shed light on some of the underlying trends in the productivity metrics and the large amount of variability that is observed, one should be appropriately cautious in interpreting these data given the imperfections in the metrics; the fact that the data reflect only a single year; and the many legitimate sources of variability, such as differences between fields and publishing styles.

More on Assessing the Glue Grant Program

0 comments

NIGMS is committed to thoughtful analysis before it initiates new programs and to careful, transparent assessment of ongoing programs at appropriate stages to help determine future directions. In this spirit, we have been assessing our large-scale programs, starting with the Protein Structure Initiative and more recently, the glue grant program.

For the glue grants (which are formally known as Large-Scale Collaborative Project Awards), we engaged in both a process evaluation and an outcomes assessment. These assessments, conducted by independent, well-qualified groups, articulated the strengths and accomplishments, as well as the weaknesses and challenges, of the glue grant program. The main conclusion of the outcomes assessment was that NIGMS should discontinue the current program and in its place create “a suite of modified program(s) to support innovative, interdisciplinary, large scale research” with the recommendation “that awards should be considerably smaller, but larger in number.”

The glue grant program was developed beginning in 1998 in anticipation of substantial increases in the NIH budget. At that time, members of the scientific community were expressing concern about how to support a trend toward interdisciplinary and collaborative science. This was discussed extensively by our Advisory Council. Here’s an excerpt from the minutes of a January 1999 meeting:

“Council discussion centered on why current mechanisms do not satisfy the need; the fact that these will be experiments in the organization of integrative science; the usefulness of consortia in collecting reference data and developing new technology that are difficult to justify on individual projects; the need to include international collaborations; and the need for rapid and open data sharing. Council voted concurrence with NIGMS plans to further develop and issue these initiatives.”

This summary captures many of the key challenges that emerged over the next 12 years in the glue grant program. I’d like to give my perspective on three key points.

First, these grants were always intended to be experiments in the organization of integrative science. One of the most striking features of the glue grants is how different they are from one another based on the scientific challenge being addressed, the nature of the scientific community in which each glue grant is embedded and the approach of the principal investigator and other members of the leadership team. The process evaluation expressed major concern about such differences between the glue grants, but in fact this diversity reflects a core principle of NIGMS: a deep appreciation for the role of the scientific community in defining scientific problems and identifying approaches for addressing them.

Second, as highlighted in both reports, the need for rapid and open data sharing remains a great challenge. All of the glue grants have included substantial investments in information technology and have developed open policies toward data release. However, making data available and successfully sharing data in forms that the scientific community will embrace are not equivalent. And of course, effective data and knowledge sharing is a challenge throughout the scientific community, not just in the glue grants.

Third, the timing for these assessments is challenging. On one hand, it is desirable to perform the assessments as early as possible after the initiation of a new program to inform program management and to indicate the need for potential adjustments.  On the other hand, the impact of scientific advances takes time to unfold and this can be particularly true for ambitious, larger-scale programs. It may be interesting to look at the impact of these programs again in the future to gauge their impact over time.

During my time at NIGMS, I have been impressed by the considerable efforts of the Institute staff involved with the glue grants. They have approached the stewardship of this novel program with a critical eye, working to find oversight mechanisms that would facilitate the impact of the grants on the relevant, broad components of the scientific community. As the current program ends, we will continue to think creatively about how best to support collaborative research, bearing in mind the glue grant assessment panel’s recommendation that we explore appropriate mechanisms to support large-scale, collaborative approaches.

Productivity Metrics and Peer Review Scores

18 comments

A key question regarding the NIH peer review system relates to how well peer review scores predict subsequent scientific output. Answering this question is a challenge, of course, since meaningful scientific output is difficult to measure and evolves over time–in some cases, a long time. However, by linking application peer review scores to publications citing support from the funded grants, it is possible to perform some relevant analyses.

The analysis I discuss below reveals that peer review scores do predict trends in productivity in a manner that is statistically different from random ordering. That said, there is a substantial level of variation in productivity metrics among grants with similar peer review scores and, indeed, across the full distribution of funded grants.

I analyzed 789 R01 grants that NIGMS competitively funded during Fiscal Year 2006. This pool represents all funded R01 applications that received both a priority score and a percentile score during peer review. There were 357 new (Type 1) grants and 432 competing renewal (Type 2) grants, with a median direct cost of $195,000. The percentile scores for these applications ranged from 0.1 through 43.4, with 93% of the applications having scores lower than 20. Figure 1 shows the percentile score distribution.

Figure 1. Cumulative number of NIGMS R01 grants in Fiscal Year 2006 as a function of percentile score.

Figure 1. Cumulative number of NIGMS R01 grants in Fiscal Year 2006 as a function of percentile score.

These grants were linked (primarily by citation in publications) to a total of 6,554 publications that appeared between October 2006 and September 2010 (Fiscal Years 2007-2010). Those publications had been cited 79,295 times as of April 2011. The median number of publications per grant was 7, with an interquartile range of 4-11. The median number of citations per grant was 73, with an interquartile range of 26-156.

The numbers of publications and citations represent the simplest available metrics of productivity. More refined metrics include the number of research (as opposed to review) publications, the number of citations that are not self-citations, the number of citations corrected for typical time dependence (since more recent publications have not had as much time to be cited as older publications), and the number of highly cited publications (which I defined as the top 10% of all publications in a given set). Of course, the metrics are not independent of one another. Table 1 shows these metrics and the correlation coefficients between them.

Table 1. Correlation coefficients between nine metrics of productivity.

Table 1. Correlation coefficients between nine metrics of productivity.

How do these metrics relate to percentile scores? Figures 2-4 show three distributions.

Figure 2. Distribution of the number of publications as a function of percentile score. The inset shows a histogram of the number of grants as a function of the number of publications.

Figure 2. Distribution of the number of publications as a function of percentile score. The inset shows a histogram of the number of grants as a function of the number of publications.

Figure 3. Distribution of the number of citations as a function of percentile score. The inset shows a histogram of the number of grants as a function of the number of citations.

Figure 3. Distribution of the number of citations as a function of percentile score. The inset shows a histogram of the number of grants as a function of the number of citations.

Figure 4. Distribution of the number of highly cited publications as a function of percentile score. Highly cited publications are defined as those in the top 10% of all research publications in terms of the total number of citations corrected for the observed average time dependence of citations.

Figure 4. Distribution of the number of highly cited publications as a function of percentile score. Highly cited publications are defined as those in the top 10% of all research publications in terms of the total number of citations corrected for the observed average time dependence of citations.

As could be anticipated, there is substantial scatter across each distribution. However, as could also be anticipated, each of these metrics has a negative correlation coefficient with the percentile score, with higher productivity metrics corresponding to lower percentile scores, as shown in Table 2.

Table 2. Correlation coefficients between the grant percentile score and nine metrics of productivity.

Table 2. Correlation coefficients between the grant percentile score and nine metrics of productivity.

Do these distributions reflect statistically significant relationships? This can be addressed through the use of a Lorenz curve Link to external web site to plot the cumulative fraction of a given metric as a function of the cumulative fraction of grants, ordered by their percentile scores. Figure 5 shows the Lorentz curve for citations.

Figure 5. Cumulative fraction of citations as a function of the cumulative fraction of grants, ordered by percentile score. The shaded area is related to the excess fraction of citations associated with more highly rated grants.

Figure 5. Cumulative fraction of citations as a function of the cumulative fraction of grants, ordered by percentile score. The shaded area is related to the excess fraction of citations associated with more highly rated grants.

The tendency of the Lorenz curve to reflect a non-uniform distribution can be measured by the Gini coefficient Link to external web site. This corresponds to twice the shaded area in Figure 5. For citations, the Gini coefficient has a value of 0.096. Based on simulations, this coefficient is 3.5 standard deviations above that for a random distribution of citations as a function of percentile score. Thus, the relationship between citations and the percentile score for the distribution is highly statistically significant, even if the grant-to-grant variation within a narrow range of percentile scores is quite substantial. Table 3 shows the Gini coefficients for the all of the productivity metrics.

Table 3. Gini coefficients for nine metrics of productivity. The number of standard deviations above the mean, as determined by simulations, is shown in parentheses below each coefficient.

Table 3. Gini coefficients for nine metrics of productivity. The number of standard deviations above the mean, as determined by simulations, is shown in parentheses below each coefficient.

Of these metrics, overall citations show the most statistically significant Gini coefficient, whereas highly cited publications show one of the least significant Gini coefficients. As shown in Figure 4, the distribution of highly cited publications is relatively even across the entire percentile score range.

Fiscal Year 2012 Budget Update

0 comments

The Senate hearing on the Fiscal Year 2012 President’s budget request for NIH happened on May 11, and you can watch the archived Webcast.

My written testimony and NIH Director Francis Collins’ written testimony on next year’s budget are also now available. The ultimate outcome will be a bill appropriating funds for NIH and its components (view history of NIH appropriations).

For more on the proposed NIGMS budget, see my update from February 15.

Fiscal Year 2011 Funding Policy

3 comments

As you may be aware, the Full-Year Continuing Appropriations Act of 2011 (Public Law 112-10) enacted on April 15 provides Fiscal Year 2011 funds for NIH and NIGMS at a level approximately 1% lower than those for Fiscal Year 2010.

NIH has released a notice outlining its fiscal policy for grant awards. This notice includes reductions in noncompeting awards to allow the funding of additional new and competing awards.

For noncompeting awards:

  • Modular grants will be awarded at a level 1% lower than the current Fiscal Year 2011 committed level.
  • Nonmodular grants will not receive any inflationary increase and will be reduced by an additional 1%.
  • Awards that have already been issued (typically at 90% of the previously committed level) will be adjusted upward to be consistent with the above policies.

For competing awards:

  • Based on the appropriation level, we expect to make approximately 866 new and competing research project grant awards at NIGMS, compared to 891 in Fiscal Year 2010.
  • It is worth noting that we received more new and competing grant applications this fiscal year—3,875 versus 3,312 in Fiscal Year 2010.

The NIGMS Fiscal Year 2011 Financial Management Plan (link no longer available) has additional information, including about funding of new investigators and National Research Service Award stipends.

Implementation Under Way for Training Strategic Plan

2 comments

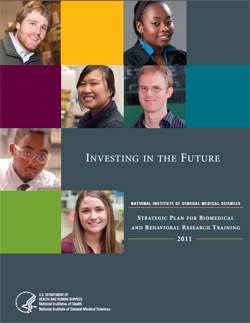
Strategic Plan for Biomedical and Behavioral Research TrainingWe have just posted the final version of Investing in the Future: National Institute of General Medical Sciences Strategic Plan for Biomedical and Behavioral Research Training. Fifteen months in the making, the plan reflects our long-standing commitment to research training and the development of a highly capable, diverse scientific workforce.

In an earlier post, I shared the plan’s four key themes.

As you’ll see, the plan considers training in the broadest sense, including not just activities supported on training grants and fellowships, but also those supported through research grants. It strongly encourages the development of training plans in all R01 and other research grant applications that request support for graduate students or postdoctoral trainees. And it endorses the use of individual development plans for these trainees as well as the overall importance of mentoring.

Finally, the plan acknowledges that trainees may pursue many different career outcomes that can contribute to the NIH mission.

My thanks to the dedicated committee of NIGMS staff who developed the plan and to the hundreds of investigators, postdocs, students, university administrators and others who took the time to give us their views throughout the planning process.

We’ve already started implementing the plan’s action items. While there are some that we can address on our own, others will require collaboration. We will again be reaching out to our stakeholders, and we look forward to continued input from and interactions with them to achieve our mutual goals.

Inspired by Stellar Student Scientists

0 comments

Intel Science Talent SearchI recently had the pleasure of attending the awards ceremony for this year’s Intel Science Talent Search. Before the award announcements, I enjoyed visiting the posters of many of the 40 finalists. These high school students displayed impressive knowledge and passion for their projects, many of which were quite sophisticated. A number of the finalists were even savvy enough to test my understanding so they could pitch their presentation to me at an appropriate level.

A highlight of the evening was definitely the award presentations themselves. The winners were clearly thrilled to be recognized among an incredibly accomplished group of young scientists. The speakers—who included Elizabeth Marincola Link to external web site, president of the Society for Science & the Public, which runs the Science Talent Search program; Paul Otellini Link to external web site, president and CEO of Intel; Miles O’Brien, who covers science on the PBS NewsHour; and one of the students, selected by his peers—uniformly stressed the importance of communicating the excitement and value of science to the public.

This is a good reminder to all of us in the scientific community about our responsibility to reach out broadly to explain what we do and why we do it in understandable terms that can inform the public and potentially inspire new members of future generations of scientists.

Proposed NIH Reorganization and NIGMS

8 comments

NCRR task force recommendations.I have previously noted that NIH has proposed creating a new entity, the National Center for Advancing Translational Sciences (NCATS), to house a number of existing programs relating to the discipline of translational science and the development of novel therapeutics. Plans for NCATS have been coupled to a proposal to dismantle the National Center for Research Resources (NCRR), in part because the largest program within NCRR, the Clinical and Translational Science Awards, would be transferred to NCATS and in part because of a statutory limitation on the number of institutes and centers at NIH.

NIH leadership established a task force to determine the placement of NCRR programs within NIH. This group initially developed a “straw model” for discussion and more recently submitted its recommendations to the NIH Director. The recommendations include transferring the Institutional Development Award (IDeA) program and some Biomedical Technology Research Centers and other technology research and development grants to NIGMS at the beginning of Fiscal Year 2012.

As you may be aware, I have expressed concerns about the processes associated with the proposal to abolish NCRR. I hope it is clear that my concerns relate to the processes and not to the NCRR programs, which I hold in very high regard. This opinion is also clearly shared by many others in the scientific community, based on comments on the Feedback NIH site and in other venues.

While there are several additional steps that would need to occur before organizational changes could take place, we at NIGMS are already deepening our understanding of the NCRR programs through meetings with NCRR staff and others directly familiar with the programs. We welcome your input, as well, particularly if you have experience with these NCRR programs. Please comment here or contact me directly.