
Fiscal Year 2011 ended on September 30, 2011. As in previous years, we have analyzed the funding results (including percentiles and success rates) for R01 grants, shown in Figures 1-5. Thanks to Jim Deatherage for preparing these data.
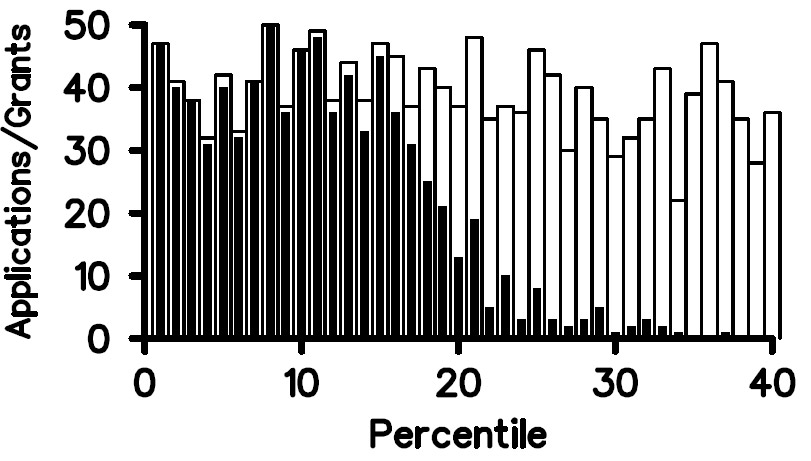
 and funded (solid bars) in Fiscal Year 2011.")

Although the number of competing R01 awards funded by NIGMS in Fiscal Year 2011 was nearly identical to those in the previous 2 years (Figure 3), the success rate declined in 2011. Factors in this decline were a sharp increase in the number of competing applications that we received in 2011 (Figure 4) along with a decrease in total funding for R01s due to an NIH-wide budget reduction. For more discussion, read posts from Sally Rockey of the NIH Office of Extramural Research on NIH-wide success rates and factors influencing them.
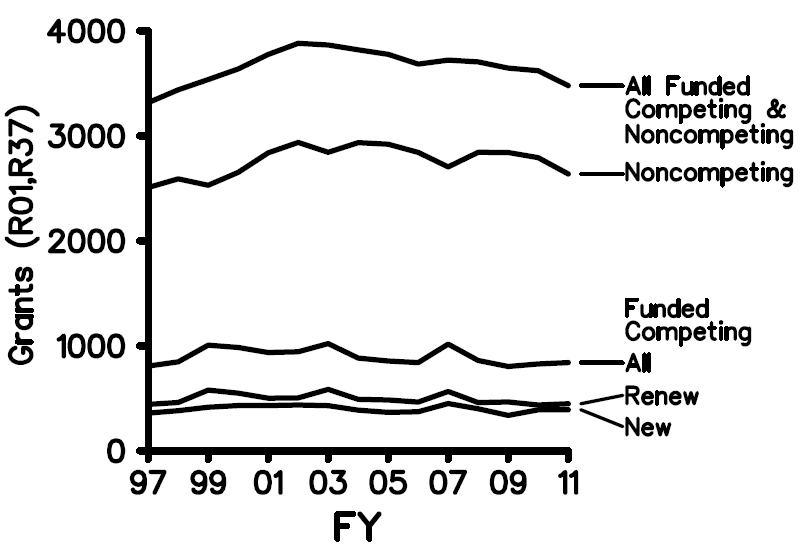
 funded in Fiscal Years 1997-2011.")
 received during Fiscal Years 1998-2012.")
Below are the total NIGMS expenditures (including both direct and indirect costs) for R01 and R37 grants for Fiscal Year 1995 through Fiscal Year 2011.
 in Fiscal Years 1995-2011")
In Fiscal Year 2012, we have received about 3,700 competing R01 grant applications (including revisions) and anticipate funding about 850 of these with the Fiscal Year 2012 appropriation. We expect the R01 success rate to be between 24% and 25%.
Because the competing application numbers and the total R01 budgets for Fiscal Years 2011 and 2012 are similar, the funding trends will likely be comparable.
For figure 2, my understanding is that the percentile/funding line is for a particular submission, whereas the percent cited (e.g. 24% for 2011) is higher because it includes those applications that were resubmitted within the calendar year and funded as A1s. Is this correct?
We are often asked to explain the difference between the payline (generally expressed as a percentile) and the success rate.
How many of those skips were due to triggering your rule about heavily funded labs?
Some of the skipped applications in Figure 1 were due to this policy. However, other common reasons for skipping over an application are scientific overlap with a PI’s other projects, programmatic balance and comments in the summary statement that indicate concerns not reflected in the score.
I’m impressed by the growth of the difference between total costs and direct costs over the last 15 years. Schools are getting far too much in indirect costs relative to what the investigator is getting to actually do the science. When you calculate in the amount of salary coverage required by the schools from your direct costs, there is very little left over to do the actual science. When is NIH going to address the rate of growth in indirects relative to the stagnation/inflationary decrease in direct costs to the investigators who actually do the work?
Competing renewal applications peaked in 2007 and have been declining pretty steadily since. I wonder why that is.
This is a consequence of the “NIH doubling” which ended in 2003. In FY 2003, NIGMS funded 1106 new and competing research grants. This fell to 978 in FY 2004 and 963 in FY 2005. Since these are primarily four year grants, most of these come back as competing renewals four year later, hence the peak in 2007.
This may be the case but the noA2 policy is very likely to put downward pressure on Type2s. A sustained effect and possibly an extinction trend.
How are these numbers calculated? If an A1 gets funded, do you count that as one submission or two submissions?
It would be also valuable to know if in the competing grants whether renewals were more successful than initial RO1 applications. Figure 3 in the recent Feedback Loop would seem to indicate that they were about the same. Is this true?
Competing renewals fare *much* better on peer review than new grants. You can see this in the second graph of this post: It is not clear to what extent this refects differences in the standards of peer review applied to Type 1 and Type 2 grants, versus the self-selection of PIs only choosing to submit Type 2 grants when they were extremely productive in the prior funding period. It is surely a combination, but the relative contributions are hard to tease out.
At the risk of seeming uninformed, I note that Figure 1 stops at the 40th percentile. Obviously no grant that scores worse than that will be funded. However, my understanding is that grants with overall impact scores worse than a certain value (maybe 5?) are not discussed at study section. Are those “triaged” grants counted in the calculations to estimate success rate? Or is a grant only counted if it undergoes “peer review” (is discussed at study section)? I just wanted to be sure I understand how the success rates are calculated and was a bit confused by the semantics.
Several years ago, the Center for Scientific Review (CSR) began the practice of having study sections not discuss applications to which reviewers, prior to the meeting, assigned poor impact scores. This policy is reasonable in view of constrained budgets and the limited likelihood that poorer applications will be funded. It also has the advantage of making the study section meetings more efficient and cost-effective. As always, however, any reviewer may request that an application be discussed, despite its initial score.
Applications with scores poorer than the 40th percentile are rarely funded.