
We have published median and mean direct cost award amounts for R01 grants, but these statistical aggregates can mask variations present in our grant portfolio. In this analysis, we illuminate two major differences in R01 award size distributions: those between single-principal investigator (PI) and multiple-PI (MPI) grants and those between new and competing renewal grants. It is worth noting that the numbers are per award values rather than the total NIGMS support provided to investigators and that award size can also be influenced by NIH-wide policies and NIGMS-specific policies that promote the consideration of multiple factors in making funding decisions.
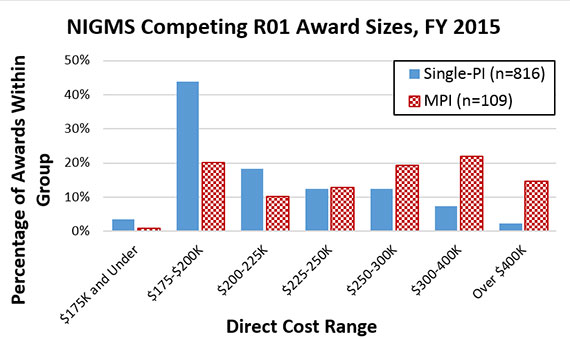
The first major distinction in NIGMS R01s exists between single-PI and MPI awards. NIH has allowed applications that identify more than one PI since Fiscal Year 2007. Many MPI applications request, and receive, larger amounts of funding than do typical single-PI applications. As shown in Figure 1, single-PI awards have a size peak in the range of $175,000-200,000 in direct costs (funds typically directly associated with the research project rather than overhead costs), while MPI awards tend to have larger budgets and a broader size distribution. MPI awards are, on average, approximately 25% larger for each additional PI (data not shown).
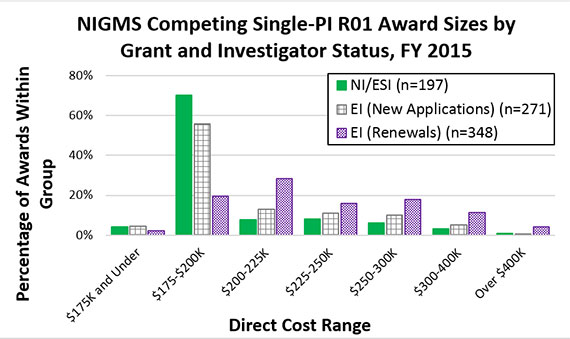
The second major distinction in NIGMS R01s exists between new and competing renewal grants. As referenced in previous Feedback Loop funding trends posts, NIGMS has a strong interest in promoting the entry of new and early stage investigators (NI/ESI) into biomedical research. One aspect of this is ensuring that these investigators have adequate support to conduct their research. While it is true that established investigators (EI) have larger R01 award sizes, most of the difference can be attributed to competing renewal awards to EIs, as shown in Figure 2. Award size also increases as a function of the age of the grant, roughly 4% larger per renewal (data not shown).
EDITOR’S NOTE: We added the following figures on May 25, 2016.
I think it would be extremely interesting to provide these data over a number of years, say 20 years, adjusted for inflation so that we can see the evolution of the purchasing power of an R01 over time.
The NIH posted an analysis on their Biomedical Research and Development Price Index (BRDPI) in 2014.
According to one comment there, the current $250K is equivalent to $175K in 2001. Time permitting, I may post an updated analysis on my Twitter feed.
Of course, we also need to also factor in the rising costs of both postdocs and graduate students ($30k salary + tuition + fringe at my institution).
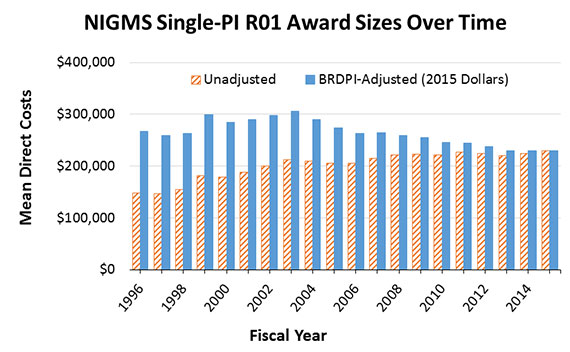
We took a look at the buying power of the average NIGMS single-PI R01 award over the last 20 years and used the Biomedical Research and Development Price Index (BRDPI) to adjust all dollar amounts to Fiscal Year 2015 values. As shown in Figure 3, which we’ve added to the original post, the buying power of NIGMS single-PI R01s peaked during the NIH budget doubling, and although the actual dollar amounts of NIGMS awards have increased over that time, they have not outpaced inflation. For example, an average NIGMS single-PI R01 in 1996 was $147,000 and had the buying power of $267,000 in today’s dollars. Compared to the 2015 NIGMS single-PI R01 average ($229,000), the unadjusted amount has increased by 56%, but the buying power has decreased by 14% over this timeframe.
Increase the direct costs – it costs more to do the same work today than it did 20 years ago.
Cut the institutional overhead to an across-the-board flat 40%. There is no justifiable reason for more. The term ‘infrastructure’ is conflated with administrator pay to argue for the high (>99%) indirect costs at many institutions.
Spread the resulting savings to develop smaller fund packages for those who score within 20-30% of the funding percentile cut-off.
While the data refer to the funded grants it is a bit like interviewing the winners at casinos; a biased sample. Most grant applications are not funded. If one averaged the effective payoff of all applicants the time for them to obtain scientific results, payoffs would grow toward the effective lifetime of hundreds of thousands of scientists. Since we have to spend so much time writing grants, the NIH budget should reflect the cost of the hours spent by highly competent researchers who are not funded. This is in the billions of dollars/year.
Most of the problems arise from a lack of funds and one way to make headway is to eliminate IDC charges on PI salary that should be covered by the institution. Let alone the salary itself.
It’s unlikely that there’ll be any meaningful changes. The lobbying power of the highest funded institutions (and their political reps) will scuttle any attempts by NIH administrators to work towards equitable distribution of funds (a process that will also enhance the quality of scientific inquiry.)
I’d be curious to see the single PI data in Figure 1 broken down by gender.
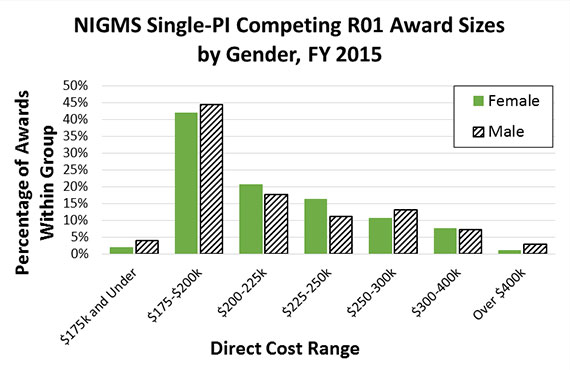
As suggested, we looked at the differences in single-PI R01 award sizes by gender and added a new figure (Figure 4) to the original post. We found that of the single-PI R01s awarded in 2015, around 25% of awards were made to female investigators. The awards made to female and male investigators were similar in size, with males having a larger proportion of both the smallest and largest grants. Bear in mind, this is a per-award analysis and does not account for any differences between male and female investigators in obtaining more than one R01. If more male investigators hold multiple NIGMS R01s (which appears to be the case based on our prior analysis of RFA-GM-16-002 eligible investigators), overall support for investigators may differ based on gender.