Category: Peer Review

Discussing Your Application’s Review with Your Program Director

2 comments

Study sections review applications three times a year, about halfway between the submission date and the second level of review by an advisory council. We are currently in the midst of the review cycle for the January 2013 Council meeting, which means that applicants will be getting their summary statements soon.

A recent post described a new NIH resource to explain the next steps after the review of your application. One of them is to contact your program director to discuss the critique, and I highly encourage this. Program directors read hundreds of summary statements each year, so we have a good idea about the comments that might have influenced your score, the likelihood that your application will be funded, and the types of revisions that might make your application more competitive.

If you’d like this input from your program director, the best first step is to send an e-mail to him or her after the summary statement is released (typically a few weeks after the study section has met to review your application) to arrange a time to talk. Program directors usually gain access to the summary statement around the same time you do, but giving us a chance to read and think about your review can facilitate a useful and productive conversation.

In addition to helping you determine next steps for your application, the conversation offers an opportunity to foster a relationship with the program director who manages grants in your area of research.

FAQs on Application Review, Next Steps

0 comments

To address questions that investigators frequently ask about the review of their applications and the next steps after review, NIH recently created an online resource, titled Next Steps. It has also added a link to this new Web site on summary statements, just below the impact score and percentile.

Questions include:

The FAQs do not cover all scenarios, but they do provide the basis for discussion with your program director.

NIGMS information on summary statements and just-in-time actions is posted for research grant, fellowship and training and workforce development applications.

“Did Council Fund My Grant?”

3 comments

Update: Revised content in this post is available on the NIGMS webpage, Council’s Role in the Funding Process.

This is a question we’re often asked shortly after the NIGMS Advisory Council meets in January, May and September. The short answer is: No. Here’s why.

As described in a previous post, our Council provides a second level of peer review of applications assigned to NIGMS. It is not a second study section. Instead, the Council provides oversight to ensure that the initial review for scientific and technical merit conducted by the study section was fair and in compliance with policy.

Each Council member is assigned a set of applications from the most recent round of study sections. He or she reads the summary statements for these applications and considers whether:

  • There was appropriate expertise to review the application.
  • The summary statement comments are substantive, appropriate and consistent with the priority score.
  • The budget is suitable for the proposed work.
  • The project addresses NIGMS programmatic needs.

Most applications pass through this second level of review without specific comment. However, Council members occasionally identify an application that they wish to bring to the attention of program staff. This is usually due to a situation in which the numerical score is better or worse than appears to be justified by the written critique. Applications identified by Council are briefly discussed in a closed session along with applications that regularly receive additional scrutiny, such as program project grants, appeals, applications from foreign institutions, MERIT awards and applications from well-funded investigators.

During each meeting, Council members review more than 1,000 applications. While they do not discuss the vast majority of them, they must vote whether to concur with the study section recommendations. For most applications, this is done en bloc.

Like study sections members, Council members give expert advice about the merit of an application, but they do not make funding decisions. Deliberations about which applications to fund occur at post-Council “paylist” meetings in which groups of NIGMS program staff discuss individual applications. The scientific reviews weigh heavily in the funding decision process, but the staff also consider programmatic priorities, research portfolio balance and other factors.

Once funding decisions have been made, it takes at least 2 to 3 weeks for a paylist to be generated and approved. At that point your program director will be able to tell you whether your application will be funded and if so, what the budget and term will be. If you have questions about the status of your application, your program director is the best source of information.

Why Overall Impact Scores Are Not the Average of Criterion Scores

10 comments

One of the most common questions that applicants ask after a review is why the overall impact score is not the average of the individual review criterion scores. I’ll try to explain the reasons in this post.

What is the purpose of criterion scores?

Criterion scores assess the relative strengths and weaknesses of an application in each of five core areas. For most applications, the core areas are significance, investigator(s), innovation, approach and environment. The purpose of the scores is to give useful feedback to PIs, especially those whose applications were not discussed by the review group. Because only the assigned reviewers give criterion scores, they cannot be used to calculate a priority score, which requires the vote of all eligible reviewers on the committee.

How do the assigned reviewers determine their overall scores?

The impact score is intended to reflect an assessment of the “likelihood for the project to exert a sustained, powerful influence on the research
field(s) involved.” In determining their preliminary impact scores, assigned reviewers are expected to consider the relative importance of each scored review criterion, along with any additional review criteria (e.g., progress for a renewal), to the likely impact of the proposed research.

The reviewers are specifically instructed not to use the average of the criterion scores as the overall impact score because individual criterion scores may not be of equal importance to the overall impact of the research. For example, an application having more than one strong criterion score but a weak score for a criterion critical to the success of the research may be judged unlikely to have a major scientific impact. Conversely, an application with more than one weak criterion score but an exceptionally strong critical criterion score might be judged to have a significant scientific impact. Moreover, additional review criteria, although not individually scored, may have a substantial effect as they are factored into the overall impact score.

How is the final overall score calculated?

The final impact score is the average of the impact scores from all eligible reviewers multiplied by 10 and then rounded to the nearest whole number. Reviewers base their impact scores on the presentations of the assigned reviewers and the discussion involving all reviewers. The basis for the final score should be apparent from the resume and summary of discussion, which is prepared by the scientific review officer following the review.

Why might an impact score be inconsistent with the critiques?

Sometimes, issues brought up during the discussion will result in a reviewer giving a final score that is different from his/her preliminary score. If this occurs, reviewers are expected to revise their critiques and criterion scores to reflect such changes. Nevertheless, an applicant should refer to the resume and summary of discussion for any indication that the committee’s discussion might have changed the evaluation even though the criterion scores and reviewer’s narrative may not have been updated. Recognizing the importance of this section to the interpretation of the overall summary statement, NIH has developed a set of guidelines to assist review staff in writing the resume and summary of discussion, and implementation is under way.

If you have related questions, see the Enhancing Peer Review Frequently Asked Questions.

Editor’s Note: In the third section, we deleted “up” for clarity.

Addressing Additional Review Criteria Questions for AREA Applications

1 comment

Of all the institutes and centers at NIH, NIGMS receives the most Academic Research Enhancement Award (AREA, R15) applications and funds the most AREA grants. This is probably because the faculty and students at eligible institutions, which have not been major recipients of NIH research grant funds, typically focus on basic research using model organisms and systems.

As Sally Rockey of the NIH Office of Extramural Research has noted, the new AREA funding opportunity announcement includes additional questions reviewers are expected to address that are related to the program’s goals of supporting meritorious research, strengthening the research environment of eligible institutions and exposing students to significant research.

With the next AREA application deadline coming up on February 25, I’d like to point out how and where applicants might address the new review considerations.

SIGNIFICANCE: If funded, will the AREA award have a substantial effect on the school/academic component in terms of strengthening the research environment and exposing students to research? Include a summary discussion at the end of the Research Plan, but provide most of the information on lab space, required equipment and facilities, and the availability of students to participate in the proposed research in the Resource page of the application. You and your institution should also include a description of the current research environment and of students who have continued in the biomedical sciences. In the Significance section as well as at the end of the Research Plan, discuss how the potential R15 support would enhance the research environment and increase the number of students exposed to meritorious research. Please remember that the research proposed should be significant, have an impact on the field and be well justified.

INVESTIGATOR: Do the investigators have suitable experience in supervising students in research? Take advantage of the Biosketch Personal Statement to provide specific information about current and former students participating in your research projects. Highlight publications with student co-authors in the Biosketch, and describe the role of students to be supported on the research project and which aim they will help with in the Budget/Personnel Justification and in the timeline at the end of the Research Plan.

APPROACH: Does the application provide sufficient evidence that the project can stimulate the interests of students so that they consider a career in the biomedical or behavioral sciences? As noted above, address this question in the Resource page and the Biosketch Personal Statement with a discussion of students who have previously worked on aspects of the research and who plan to pursue scientific careers. At the end of the Research Plan, I highly recommend including a list of students and a timeline for what each of them would be doing and what research question or approaches they would be exposed to during the R15 support period.

ENVIRONMENT: Does the application demonstrate the likely availability of well-qualified students to participate in the research project? Address this question in both the Resource page and the Biosketch Personal Statement by discussing your record of recruiting interested students who are excited about doing research and helping you accomplish your specific aims. Does the application provide sufficient evidence that students have in the past or are likely to pursue careers in the biomedical or behavioral sciences? As indicated above, with assistance from your institution, use the Resource page to provide a description of students who have majored in the biomedical sciences and who have gone on to graduate or medical school or other biomedical science careers. Use the Biosketch Personal Statement to describe students you have supervised.

Productivity Metrics and Peer Review Scores, Continued

11 comments

In a previous post, I described some initial results from an analysis of the relationships between a range of productivity metrics and peer review scores. The analysis revealed that these productivity metrics do correlate to some extent with peer review scores but that substantial variation occurs across the population of grants.

Here, I explore these relationships in more detail. To facilitate this analysis, I separated the awards into new (Type 1) and competing renewal (Type 2) grants. Some parameters for these two classes are shown in Table 1.

Table 1. Selected=

Table 1. Selected parameters for the population of Type 1 (new) and Type 2 (competing renewal) grants funded in Fiscal Year 2006: average numbers of publications, citations and highly cited citations (defined as those being in the top 10% of time-corrected citations for all research publications).

For context, the Fiscal Year 2006 success rate was 26%, and the midpoint on the funding curve was near the 20th percentile.

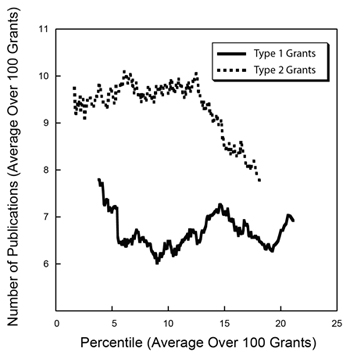
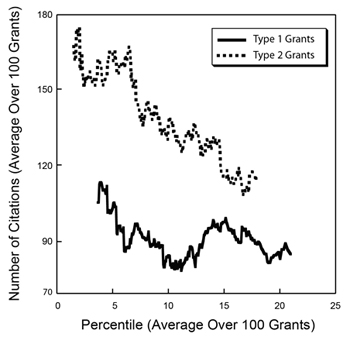
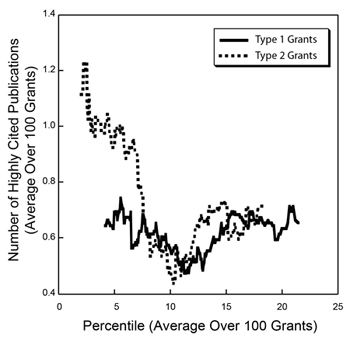
To better visualize trends in the productivity metrics data in light of the large amounts of variability, I calculated running averages over sets of 100 grants separately for the Type 1 and Type 2 groups of grants, shown in Figures 1-3 below.

Figure 1. Running averages for the number of publications over sets of 100 grants funded in Fiscal Year 2006 for Type 1 (new, solid line) and Type 2 (competing renewal, dotted line) grants as a function of the average percentile for that set of 100 grants.

Figure 1. Running averages for the number of publications over sets of 100 grants funded in Fiscal Year 2006 for Type 1 (new, solid line) and Type 2 (competing renewal, dotted line) grants as a function of the average percentile for that set of 100 grants.

Figure 2. Running averages for the number of citations over sets of 100 grants funded in Fiscal Year 2006 for Type 1 (new, solid line) and Type 2 (competing renewal, dotted line) grants as a function of the average percentile for that set of 100 grants.

Figure 2. Running averages for the number of citations over sets of 100 grants funded in Fiscal Year 2006 for Type 1 (new, solid line) and Type 2 (competing renewal, dotted line) grants as a function of the average percentile for that set of 100 grants.

Figure 3. Running averages for the number of highly cited publications over sets of 100 grants funded in Fiscal Year 2006 for Type 1 (new, solid line) and Type 2 (competing renewal, dotted line) grants as a function of the average percentile for that set of 100 grants.

Figure 3. Running averages for the number of highly cited publications over sets of 100 grants funded in Fiscal Year 2006 for Type 1 (new, solid line) and Type 2 (competing renewal, dotted line) grants as a function of the average percentile for that set of 100 grants.

These graphs show somewhat different behavior for Type 1 and Type 2 grants. For Type 1 grants, the curves are relatively flat, with a small decrease in each metric from the lowest (best) percentile scores that reaches a minimum near the 12th percentile and then increases somewhat. For Type 2 grants, the curves are steeper and somewhat more monotonic.

Note that the curves for the number of highly cited publications for Type 1 and Type 2 grants are nearly superimposable above the 7th percentile. If this metric truly reflects high scientific impact, then the observations that new grants are comparable to competing renewals and that the level of highly cited publications extends through the full range of percentile scores reinforce the need to continue to support new ideas and new investigators.

While these graphs shed light on some of the underlying trends in the productivity metrics and the large amount of variability that is observed, one should be appropriately cautious in interpreting these data given the imperfections in the metrics; the fact that the data reflect only a single year; and the many legitimate sources of variability, such as differences between fields and publishing styles.

Productivity Metrics and Peer Review Scores

18 comments

A key question regarding the NIH peer review system relates to how well peer review scores predict subsequent scientific output. Answering this question is a challenge, of course, since meaningful scientific output is difficult to measure and evolves over time–in some cases, a long time. However, by linking application peer review scores to publications citing support from the funded grants, it is possible to perform some relevant analyses.

The analysis I discuss below reveals that peer review scores do predict trends in productivity in a manner that is statistically different from random ordering. That said, there is a substantial level of variation in productivity metrics among grants with similar peer review scores and, indeed, across the full distribution of funded grants.

I analyzed 789 R01 grants that NIGMS competitively funded during Fiscal Year 2006. This pool represents all funded R01 applications that received both a priority score and a percentile score during peer review. There were 357 new (Type 1) grants and 432 competing renewal (Type 2) grants, with a median direct cost of $195,000. The percentile scores for these applications ranged from 0.1 through 43.4, with 93% of the applications having scores lower than 20. Figure 1 shows the percentile score distribution.

Figure 1. Cumulative number of NIGMS R01 grants in Fiscal Year 2006 as a function of percentile score.

Figure 1. Cumulative number of NIGMS R01 grants in Fiscal Year 2006 as a function of percentile score.

These grants were linked (primarily by citation in publications) to a total of 6,554 publications that appeared between October 2006 and September 2010 (Fiscal Years 2007-2010). Those publications had been cited 79,295 times as of April 2011. The median number of publications per grant was 7, with an interquartile range of 4-11. The median number of citations per grant was 73, with an interquartile range of 26-156.

The numbers of publications and citations represent the simplest available metrics of productivity. More refined metrics include the number of research (as opposed to review) publications, the number of citations that are not self-citations, the number of citations corrected for typical time dependence (since more recent publications have not had as much time to be cited as older publications), and the number of highly cited publications (which I defined as the top 10% of all publications in a given set). Of course, the metrics are not independent of one another. Table 1 shows these metrics and the correlation coefficients between them.

Table 1. Correlation coefficients between nine metrics of productivity.

Table 1. Correlation coefficients between nine metrics of productivity.

How do these metrics relate to percentile scores? Figures 2-4 show three distributions.

Figure 2. Distribution of the number of publications as a function of percentile score. The inset shows a histogram of the number of grants as a function of the number of publications.

Figure 2. Distribution of the number of publications as a function of percentile score. The inset shows a histogram of the number of grants as a function of the number of publications.

Figure 3. Distribution of the number of citations as a function of percentile score. The inset shows a histogram of the number of grants as a function of the number of citations.

Figure 3. Distribution of the number of citations as a function of percentile score. The inset shows a histogram of the number of grants as a function of the number of citations.

Figure 4. Distribution of the number of highly cited publications as a function of percentile score. Highly cited publications are defined as those in the top 10% of all research publications in terms of the total number of citations corrected for the observed average time dependence of citations.

Figure 4. Distribution of the number of highly cited publications as a function of percentile score. Highly cited publications are defined as those in the top 10% of all research publications in terms of the total number of citations corrected for the observed average time dependence of citations.

As could be anticipated, there is substantial scatter across each distribution. However, as could also be anticipated, each of these metrics has a negative correlation coefficient with the percentile score, with higher productivity metrics corresponding to lower percentile scores, as shown in Table 2.

Table 2. Correlation coefficients between the grant percentile score and nine metrics of productivity.

Table 2. Correlation coefficients between the grant percentile score and nine metrics of productivity.

Do these distributions reflect statistically significant relationships? This can be addressed through the use of a Lorenz curve Link to external web site to plot the cumulative fraction of a given metric as a function of the cumulative fraction of grants, ordered by their percentile scores. Figure 5 shows the Lorentz curve for citations.

Figure 5. Cumulative fraction of citations as a function of the cumulative fraction of grants, ordered by percentile score. The shaded area is related to the excess fraction of citations associated with more highly rated grants.

Figure 5. Cumulative fraction of citations as a function of the cumulative fraction of grants, ordered by percentile score. The shaded area is related to the excess fraction of citations associated with more highly rated grants.

The tendency of the Lorenz curve to reflect a non-uniform distribution can be measured by the Gini coefficient Link to external web site. This corresponds to twice the shaded area in Figure 5. For citations, the Gini coefficient has a value of 0.096. Based on simulations, this coefficient is 3.5 standard deviations above that for a random distribution of citations as a function of percentile score. Thus, the relationship between citations and the percentile score for the distribution is highly statistically significant, even if the grant-to-grant variation within a narrow range of percentile scores is quite substantial. Table 3 shows the Gini coefficients for the all of the productivity metrics.

Table 3. Gini coefficients for nine metrics of productivity. The number of standard deviations above the mean, as determined by simulations, is shown in parentheses below each coefficient.

Table 3. Gini coefficients for nine metrics of productivity. The number of standard deviations above the mean, as determined by simulations, is shown in parentheses below each coefficient.

Of these metrics, overall citations show the most statistically significant Gini coefficient, whereas highly cited publications show one of the least significant Gini coefficients. As shown in Figure 4, the distribution of highly cited publications is relatively even across the entire percentile score range.

Enhancing Peer Review Survey Results

5 comments

One of the key principles of the NIH Enhancing Peer Review efforts was a commitment to a continuous review of peer review. In that spirit, NIH conducted a broad survey of grant applicants, reviewers, advisory council members and NIH program and review officers to examine the perceived value of many of the changes that were made. The results of this survey are now available. The report analyzes responses from these groups on topics including the nine-point scoring scale, criterion scores, consistency, bulleted critiques, enhanced review criteria and the clustering of new investigator and clinical research applications.

NIH Enhancing Peer Review Survey criterion score responses from applicants.

NIH Enhancing Peer Review Survey criterion score responses from applicants.

Please feel free to comment here or on Rock Talk, where NIH Deputy Director for Extramural Research Sally Rockey recently mentioned the release of this survey.

NIH-Wide Correlations Between Overall Impact Scores and Criterion Scores

5 comments

In a recent post, I presented correlations between the overall impact scores and the five individual criterion scores for sample sets of NIGMS applications. I also noted that the NIH Office of Extramural Research (OER) was performing similar analyses for applications across NIH.

OER’s Division of Information Services has now analyzed 32,608 applications (including research project grant, research center and SBIR/STTR applications) that were discussed and received overall impact scores during the October, January and May Council rounds in Fiscal Year 2010. Here are the results by institute and center:

Correlation coefficients between the overall impact score and the five criterion scores for 32,608 NIH applications from the Fiscal Year 2010 October, January and May Council rounds.

Correlation coefficients between the overall impact score and the five criterion scores for 32,608 NIH applications from the Fiscal Year 2010 October, January and May Council rounds. High-res. image (112KB JPG)

This analysis reveals the same trends in correlation coefficients observed in smaller data sets of NIGMS R01 grant applications. Furthermore, no significant differences were observed in the correlation coefficients among the 24 NIH institutes and centers with funding authority.