
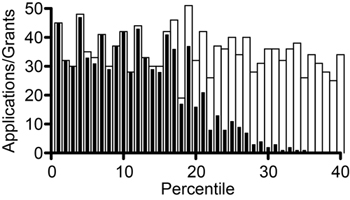
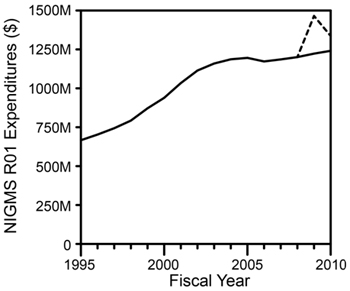
Fiscal Year 2010 ended on September 30, 2010. We have now analyzed the overall results for R01 grants, shown in Figures 1-3.
The total NIGMS expenditures (including both direct and indirect costs) for R01 grants are shown in Figure 3 for Fiscal Year 1996 through Fiscal Year 2010.
What do we anticipate for the current fiscal year (Fiscal Year 2011)? At this point, no appropriation bill has passed and we are operating under a continuing resolution through March 4, 2011, that funds NIH at Fiscal Year 2010 levels. Because we do not know the final appropriation level, we are not able at this time to estimate reliably the number of competing grants that we will be able to support. We can, however, estimate the number of research project grant applications in the success rate base (correcting for applications that are reviewed twice in the same fiscal year). We predict that this number will be approximately 3,875, an increase of 17% over Fiscal Year 2010.
UPDATE: The original post accidentally included a histogram from a previous year. The post now includes the correct Fiscal Year 2010 figure.
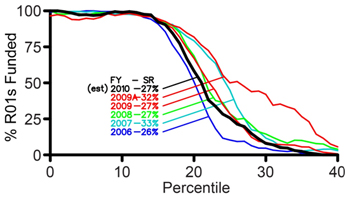
Do these curves indicate that NIGMS was awarding grants that were placed in the 20-30 percentile? Were these exemptions or special cases?
Of course they were “special cases”, Anonymous, although the fact that ICs pick up a number of grants past the established or putative payline is hardly special. This is just standard operating procedure.
The great thing about NIGMS is they actually present the data on just what they are doing. One wonders what other ICs have to hide since they do not go ahead and present these types of data 🙂
all snark aside, my suspicion is that there really wouldn’t be that much variation in the number of “skips” and “exceptions” across ICs….
The shape of the “2009A” curve is very different from the other curves. Instead of using ARRA funding to shift the midpoint, but keep the curve relatively S-shaped, it looks like ARRA funds were mostly used to fund grants with worse percentiles than the midpoints, but that few grants better than the midpoint were rescued from not being funded. Does that reflect the fact that those grants near the midpoint that weren’t funded with regular appropriations were deemed undesirable for funding per se, such as on the basis of portfolio balance, etc?
The circumstances regarding Recovery Act funding of R01 applications were somewhat complex. For example, some applications were not funded because a revision from a later Council round was funded instead. Some were not funded because a revision for the next fiscal year had scored well and the applicant elected to wait for the potential of a full (typically) 4-year award rather than accept a 2-year Recovery Act-funded award. These applications show up as unfunded, even though the projects were funded.
Can you please clarify the meaning of, “We can estimate that the number of research project grant applications in the success rate base (correcting for applications that are reviewed twice in the same fiscal year).”
Thanks!
For a given fiscal year, the success rate is calculated by dividing the number of funded research project grants by the number of applications. Applications that are revised and resubmitted within the same fiscal year are only counted once. This is typically less than 10% of the applications. The corrected number of applications is referred to as the success rate base. See http://www.nigms.nih.gov/Research/Application/Pages/SuccessRateFAQs.aspx for more information.
I have always wondered about the rationale for doing this. After all, the simplest and clearest approach would be to treat all original and revised as unique submissions. The second clearest approach would be to treat all original and revised submissions of the same proposal as a single submission. The way NIH does it seems nutty, unless the only purpose is to artificially look like you are funding a higher percentage of applications than people would naturally* assume.
*again, this calculation is not the first thing anyone would assume when seeing the term “success rate”.
My understanding from extensive discussion with numerous program staff at one particular IC is that for that IC, the curve would look *much* steeper than NIGMS’s, with essentially 100% of grants inside the payline getting funded, and then a precipitous drop in the success rate outside the payline, with much fewer “pick-ups”. This obviously represents a policy preference for study section rankings over program staff discretion.
Of course, CPP, your IC could just be blowing smoke with an official line. Until one sees the data, such as courageously provided by NIGMS, your conversations could be no different than the usual mantras designed to keep PIs from freaking out.
I don’t think so. In a well-publicized case, this IC declined to fund the competitive renewal of the single R01 held by a very productive investigator for decades that was outside the published nominal payline by less than a single percentage point.
That’s pretty thin evidence. After all, one of the benefits of having a PR message that says “we stick closely to the payline” (even if they do not) is precisely that they have an excuse to stiff a PI in this situation.
Look, I’m one who believes quite strongly that one role of Program pickups is to provide some back-stopping of the inherent conservative and self-reflecting nature of study sections. If there is an IC that does not *ever* do any stepping outside of the primary review order, well, this would be a decent test. If, that is, we had any good way to evaluate the reflecting room effect of only those who have been funded by the system participating in deciding who else gets funded by the system.
But my liking of the tiered selection process also makes it difficult for me to understand *why* any IC would abandon what I see as not just their right but their *responsibility* to provide an additional, independent set of inputs into what gets funded.
Judging by Fig.1, only few proposals with better than 20% ranking were not funded in 2010. It would be very interesting to hear how NIGMS decides which “gray area” proposals to fund and perhaps see those guidelines converted into an open policy.
“But my liking of the tiered selection process also makes it difficult for me to understand *why* any IC would abandon what I see as not just their right but their *responsibility* to provide an additional, independent set of inputs into what gets funded.”
Because an IC has made the normative decision to favor the outcome of the study section peer-review process over the discretion of program? And BTW, it sounds to me like there exists no publicly available information that you would consider as evidence relevant to the “strictness” of an IC’s stated payline. In this regard, you are in the realm of “faith”, not “reason”.
There’s more than one area of Program behavior that they will never ever admit to in public but yet they quite obviously do none the less. So I’d place it more in the category of “cynical suspicion” than “faith” but whatevs….
I am working on posts on the roles of our Advisory Council and program staff in making funding recommendations. I hope that these will help clarify the process by which an application moves from its initial peer review to a funded grant.
Hey, did you guys post the wrong graph? A commenter at my blog has noticed this looks really similar to the 2008 graph….?
We inadvertently posted the histogram from a previous year. We have now incorporated the correct figure. Thanks to your alert reader for noticing our error.