
In a previous post, I described some initial results from an analysis of the relationships between a range of productivity metrics and peer review scores. The analysis revealed that these productivity metrics do correlate to some extent with peer review scores but that substantial variation occurs across the population of grants.
Here, I explore these relationships in more detail. To facilitate this analysis, I separated the awards into new (Type 1) and competing renewal (Type 2) grants. Some parameters for these two classes are shown in Table 1.
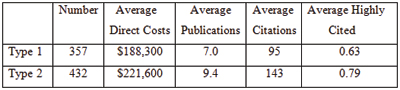
For context, the Fiscal Year 2006 success rate was 26%, and the midpoint on the funding curve was near the 20th percentile.
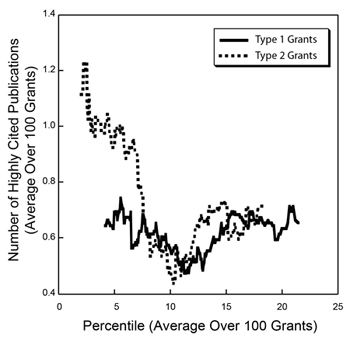
To better visualize trends in the productivity metrics data in light of the large amounts of variability, I calculated running averages over sets of 100 grants separately for the Type 1 and Type 2 groups of grants, shown in Figures 1-3 below.
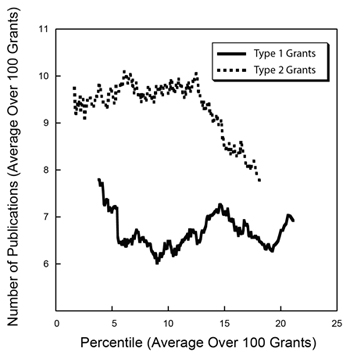
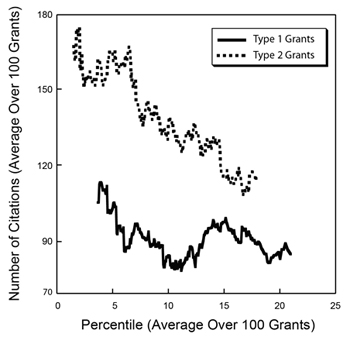
These graphs show somewhat different behavior for Type 1 and Type 2 grants. For Type 1 grants, the curves are relatively flat, with a small decrease in each metric from the lowest (best) percentile scores that reaches a minimum near the 12th percentile and then increases somewhat. For Type 2 grants, the curves are steeper and somewhat more monotonic.
Note that the curves for the number of highly cited publications for Type 1 and Type 2 grants are nearly superimposable above the 7th percentile. If this metric truly reflects high scientific impact, then the observations that new grants are comparable to competing renewals and that the level of highly cited publications extends through the full range of percentile scores reinforce the need to continue to support new ideas and new investigators.
While these graphs shed light on some of the underlying trends in the productivity metrics and the large amount of variability that is observed, one should be appropriately cautious in interpreting these data given the imperfections in the metrics; the fact that the data reflect only a single year; and the many legitimate sources of variability, such as differences between fields and publishing styles.
For your next analysis, is there any way to manage multiple grant attributions (across all NIH awards)?
It is possible to capture all grants that are associated with a given paper (with the usual caveats about accuracy). The number of grants (or some other function) could be used as a weighting factor to down-weight papers citing multiple grants. Decisions would have to be made about how to count training grants, center grants, and so on, in addition to research grants.
This analysis would cut both ways, in my estimation. Clearly, there are a lot of “amazingly productive” labs that only look that way because they have so many grants contributing to each paper. Consequently the real productivity of single-grant operations can be unfairly obscured. However, it may also suggest that multiple awards are *necessary* to fully realize one PI’s potential. Two very different policy implications.
One caveat to this is that in general, type 2 grants are from more sr investigators, whereas type I are not. Sr investigators have an easier time publishing and will generate more citations because they are recognized. So productivity based on such parameters are skewed in favor of srs.
Type 2 grants do indeed come from established investigators. Type 1 grants come both from early stage and more senior investigators. The results presented are simply the data. I deliberately did not provide much interpretation since such interpretation depends on careful consideration of factors such as those you raise.
Another interesting comparison would be productivity of t1 grants from esi/ni vs t1 non esi/ni with one R01 (as drugmonkey mentioned above). That would complement your current analysis and help decipher the issue I raised.
There is also a lag between initiation of grant-supported activities and publication. If we assume an award period of 4 years, the ~2 publication difference in productivity can be entirely explained by a 12 month lag time for a first-time award.
Dear Jeremy,
I am a long-time fan of these statistical studies. Much more recent is my decision to post online. By “Average Publication” can I assume that you mean the average number of the total number of the publications associated with a given grant in a four year period? By “Average Citation” can I assume that you mean the average total number of citations to all the publications associated with a given grant in a four year period? As you know, the second value is time-dependent so one needs to know the date on which citation data was obtained. What is it?
This must sound terribly pedantic..
Michael
You are correct about the averages. The publications were from Fiscal Years 2007-2010 and the citations were through April 2011, as noted in the earlier post. Thanks for asking for clarification.
I don’t understand the publication statistics. What does it mean for a type 1 grant to have pubs? Is this the number of pubs that credit the grant x number of years after the award? Similarly, what does the number of pubs for a type 2 grant mean? Is this the number listed in the progress report at the time of renewal?
It is interesting to see the correlation between Productivity metrics and variability. But as you mentioned that there are many other aspects which are worth considering and working upon. Statistical data on legacy publications would be interesting to see. Similarly, apart from fields and publishing styles, it would be interesting to analyze data generated from different geographical locations and languages. It would also be interesting to see if the papers published by female authors exhibit some different patterns or not.