On January 17, the President signed into law the Consolidated Appropriations Act of 2014, funding the Federal Government for the remainder of the fiscal year and providing increased support for NIH relative to the post-sequester levels of 2013. The NIGMS Fiscal Year 2014 budget is $2.359 billion, which is about $66 million, or 2.9%, higher than it was in Fiscal Year 2013.
It’s too early to know what this will mean for the NIGMS grant application success rate—the number of competing R01 applications we fund divided by the total number of competing R01 applications we receive. A number of other, largely independent factors in addition to the budget can impact the success rate, as well. We hope that our latest analysis of NIGMS funding trends illuminates the interplay among some of these factors. Thanks to Tony Moore, Jim Deatherage and Ching-Yi Shieh for help with the data collection and analysis.
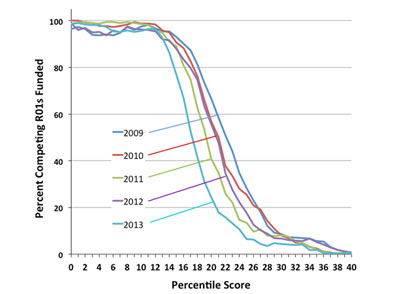
Figure 1 shows the percentage of R01 applications funded by NIGMS as a function of percentile scores for Fiscal Years 2009-2013. Fewer grants scoring above about the 12th percentile were funded last year than in the previous 4 years. In fact, the funding curves shifted more to the left each year in this period, except in 2012, which had a slightly better success rate than 2011. This was due in part to a dip in noncompeting R01 grants that had to be funded along with no increase in the number of competing applications relative to 2011. (For a 4-year R01, the second, third and fourth years are all noncompeting grants because they are funded without review by a study section. The funds required to pay the noncompeting awards are often referred to as “out-year commitments.”) Funding levels fell again in Fiscal Year 2013 due to the sequester cuts and increases in the numbers of competing applications and noncompeting grants (see below).
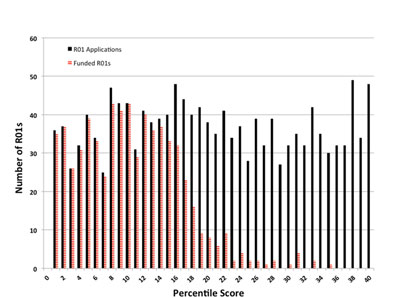
Figure 2 presents a more granular view of the data for Fiscal Year 2013. The solid black bars correspond to the number of NIGMS competing R01 applications that scored at each percentile. The striped red bars show the number of these applications that we funded.
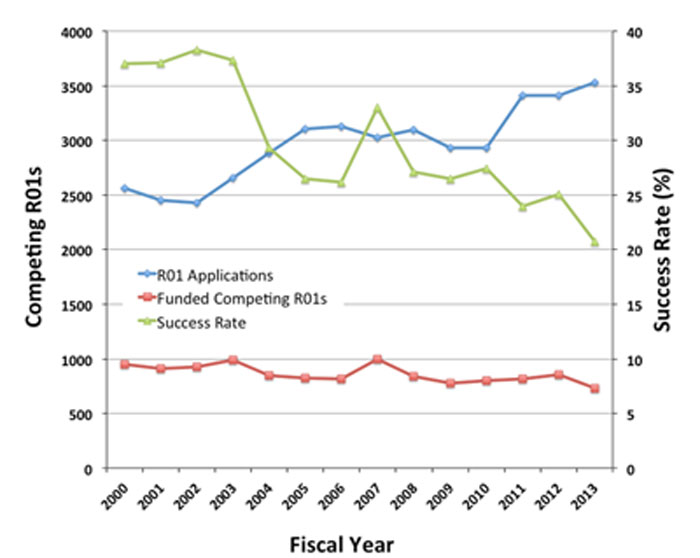
Figure 3 shows the success rate for Fiscal Years 2000-2013 (green line with triangles; right axis), the total number of NIGMS R01 applications each year (blue line with diamonds) and the number of funded competing R01 grants (red line with squares, left axis). Between Fiscal Years 2000 and 2003, the last year of the NIH budget doubling, the success rate was 37-38%. After the budget doubling ended, the success rate declined, falling to 26% in 2006. In 2007, the success rate jumped to 33%, largely due to a combination of a budget increase for NIH and a dip in the number of noncompeting grants NIGMS had to fund that year. (See below for more about changes in the number of noncompeting grants.) Over the next 6 years, the success rate for R01s dropped to 21%, the lowest level in two decades. Note that the Fiscal Year 2013 success rate for all research project grants (RPGs), which include R00s, R01s, R15s, R21s, R37s, P01s, DP1s, DP2s and U01s, was 19.9%. This is lower than the success rate for R01s alone, which was 21%.
One reason the success rate has fallen is that the number of applications increased between Fiscal Years 2002-2005 and then again between Fiscal Years 2010-2013. Similar trends are seen NIH-wide and are the result of a 50% increase in the number of investigators applying for grants along with a smaller increase in the average number of applications submitted per investigator.
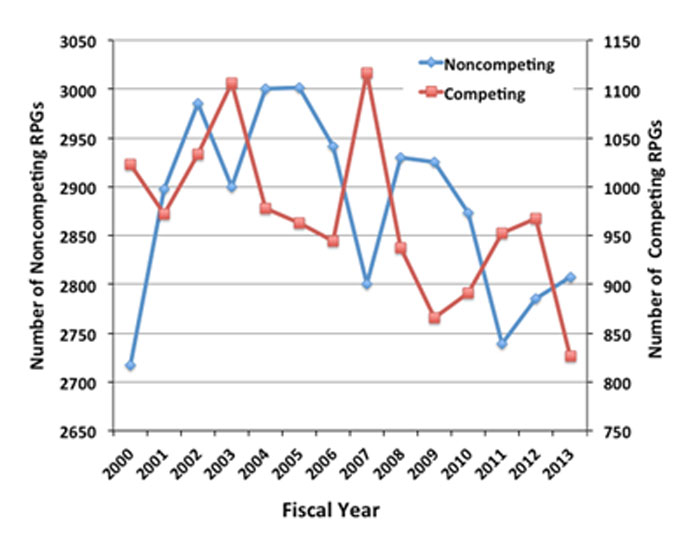
Another factor that influences the success rate is the number of noncompeting awards. The more noncompeting awards we need to make in a given year, the fewer competing grants we can fund. The number of noncompeting RPGs cycles with a 4-year period, as shown in Figure 4.
This cycle was apparently set in the early 1990s when the Institute shifted the duration of most competing RPGs from 5 to 4 years. The result was that the last group of 5-year awards and the first group of 4-year awards ended in the same year, creating a significant dip in noncompeting grants and a corresponding jump in competing grants that the Institute could fund. The bolus of grants awarded that year kept noncompeting commitments high for the next 3 years, until they all came up for renewal again. As you can see in Figure 4, the cycle has persisted to this day.
The cycle may lead you to wonder if you should try to time your application to correspond to a trough in noncompeting grants. You might get lucky and have all of the factors that drive success rate work in your favor. However, if other factors act to decrease the success rate, you might end up worse off. For example, even though 2011 was a trough year for noncompeting grants (Figure 4, blue line with diamonds), a jump in the number of applications (Figure 3, blue line with diamonds) worked in the opposite direction, and the success rate actually fell (Figure 3, green line with triangles).
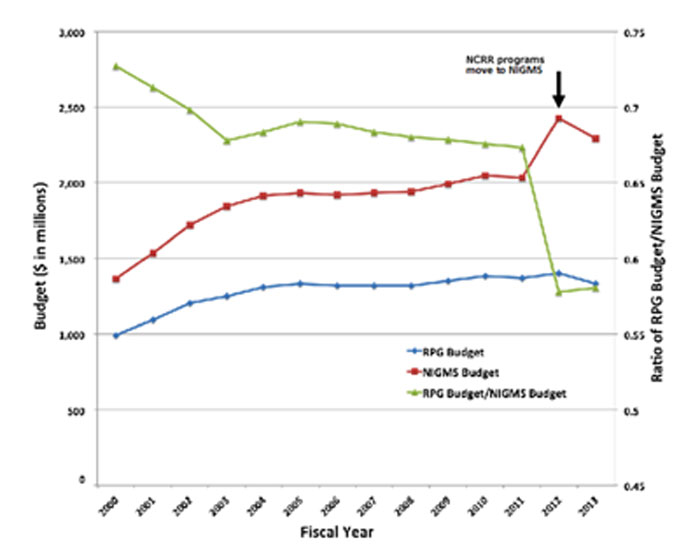
Finally, the Institute’s budget is also a factor in determining the success rate. Figure 5 shows the NIGMS budget (red line with squares, left axis), the budget committed to competing and noncompeting RPGs (blue line with diamonds, left axis) and the ratio of the RPG budget to the total NIGMS budget (green line with triangles, right axis).
The Institute’s budget grew during the NIH budget doubling (1998-2003). It also jumped by nearly $400 million when the Institutional Development Award (IDeA) and Biotechnology Research Resources programs moved from the former National Center for Research Resources to NIGMS. A variety of pressures were responsible for the ~2% decline in the ratio of RPG funds to the NIGMS budget that occurred during Fiscal Years 2005-2011, including commitments to targeted initiatives and increased funding for training programs.
Because we don’t yet know the number of applications we will receive or the number of noncompeting grants that will end early due to retirements or other events, we can’t predict what our success rate will be in Fiscal Year 2014. We hope, however, that the steps we are taking to bolster our commitment to investigator-initiated RPGs will have a positive impact on the success rate.


Thanks for the most detailed explanation of NIH funding I have ever seen. Was 2012 in the first paragraph a typo (should it be 2013), or the 2014 budget of GM is indeed 2.9% higher than the one in 2012 (which is good news)?
Thank you for the feedback—and for catching the typo, which we have corrected within the post.
Very useful information. Thanks. Two questions.
1) It appears that some people ( a small minority) with very good percentile scores (e.g., <5) are not funded – what is the explanation for that?
2) It also appears that there is not a precipitous fall-of in funding rates at a certain percentile point. The fall-off occurs more slowly over approximately 10 percentile units. For example, the fall-off from the 80% funding rate to 20% funding rate spans approximately 10 units on the percentile score. What is the explanation for why someone with a 14th percentile may not get funded yet someone with a 24th percentile is funded? Appreciate it. Thanks
Figure 1 together with the strikingly decreasing level of renewals clearly shows that the system has been steadily rotting: wrong judges gives grants to wrong sportsmen, what can you expect then? Had competent judges had given the prize to the right sportsmen, she level of renewal should have been risen.