
In an earlier blog post, I presented data on the first competing renewal rates of R01 projects that NIGMS awarded to new and established investigators. The analysis showed that no renewal application was submitted for a substantial percentage of projects—30% of new projects from new investigators and 45% of new projects from established investigators. This raises questions, such as those suggested by Feedback Loop readers, including:
- Do projects for which no renewal is submitted generally have less productivity or scientific impact?
- Are new projects awarded to established investigators more likely to represent the second or third award to that investigator?
I’ve tried to explore these questions in a further analysis.
Do projects for which no renewal is submitted generally have less productivity or scientific impact?
To address this question, I looked at some aspects of project productivity and impact. I compared publications and citations associated with new R01 projects awarded by NIGMS to new and established investigators across four competing renewal categories that represent the status of each grant 7 or more years after the initial award. The categories are:
- No T2 Application: No Type 2 (T2) competing renewal application was submitted.
- T2 Application: At least one T2 was submitted.
- T2 Not Funded: Renewal application was submitted but was not successful.
- T2 Funded: Renewal application was successful either with an original or an amended T2 application.
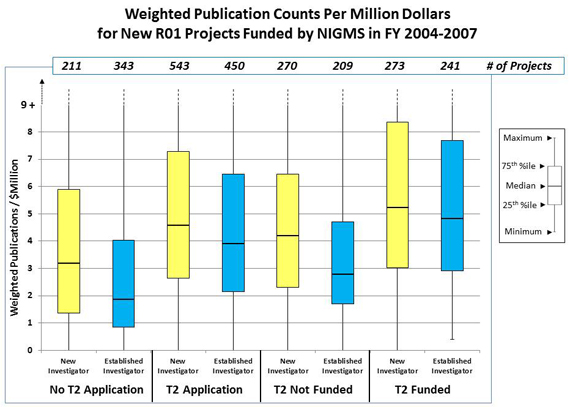
Figure 1 shows the distribution of publication counts for new R01 projects awarded to new and established investigators across the four grant status categories. The counts were weighted for the number of NIH research grants acknowledged in a publication; within this cohort, publications from established investigator projects acknowledged, on average, 2.0 NIH research grants and publications from new investigators acknowledged, on average, 1.7 NIH grants. The publication counts were also normalized per million dollars of total cost in order to account for different project durations. Within each group of investigators, the projects for which no renewal application was submitted had the lowest median number of publications, while those for which the project was renewed had the highest. Within each of the four status categories, the median weighted publication count per project was higher for new investigator projects than for established investigator projects.
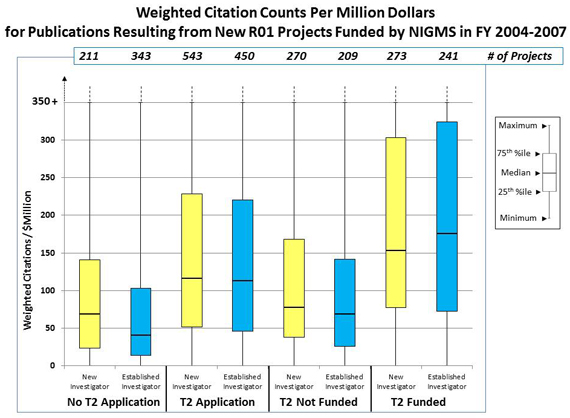
To evaluate the impact of the same publications from these projects, I used two approaches: weighted citation counts per million dollars in total cost research support and weighted citation counts per million dollars normalized for scientific topic area, publication type and publication year (“weighted, normalized citation impact”). As shown in Figure 2, projects for which competing renewal applications were submitted had a higher median number of weighted citations compared to those projects for which no competing renewal applications were submitted. Renewed projects had the highest median weighted citation counts.
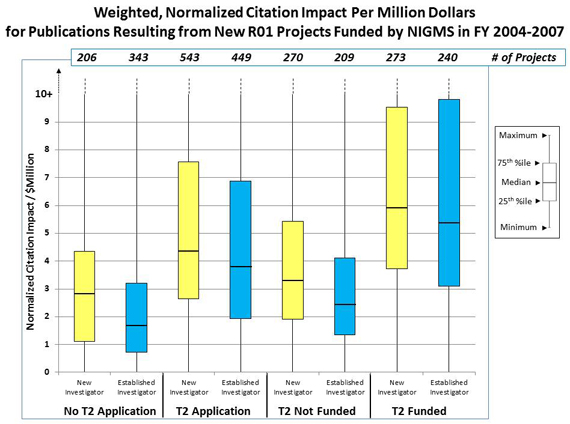
A comparison of the weighted, normalized citation impact for projects for the investigator and grant status categories in Figure 3 showed that renewed projects had the highest median normalized citation impact and those for which no competing renewal application was submitted had the lowest median citation impact. The median of the weighted, normalized citation impact was higher for new investigator projects than it was for established investigator projects within every grant status category.
To summarize, projects for which no renewal was submitted had lower productivity and impact outcomes, based on the publication and citation metrics analyzed here, than those for which a renewal was submitted. The analysis also showed that, as a group, renewed projects had higher productivity and impact outcomes than those that were not renewed. As with the data described in my previous post, the data presented above support the practice of giving special consideration to applications from new investigators.
Are new projects awarded to established investigators more likely to represent the second or third award to that investigator?
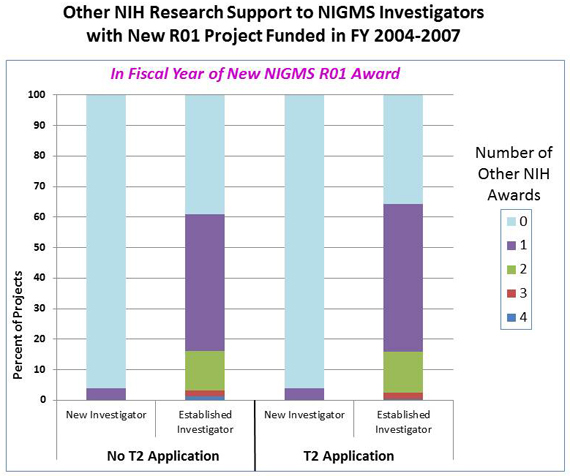
To explore this question, I examined the investigators’ other NIH research support during the same fiscal year in which the new R01 grant was awarded. As shown in Figure 4, 4% of new investigator projects were to investigators who also received another R01-type research project grant (R01, R37, DP1) in the same fiscal year, while more than 60% of the established investigator projects were to investigators with at least one other R01-type research project grant.
The analysis showed no correlation between the likelihood of an established investigator submitting a first competing renewal application and either holding or not holding another R01-type research grant at the time of the new award. Examining the support of investigators near the time of renewing the new award yielded similar results. The number of established investigators within this cohort who were supported by more than two other R01-type research grants at the time of the new award was too small for a correlation analysis between the number of other active awards and the probability of submitting a first renewal.
While this analysis can help us understand competing renewal trends, it is important to keep in mind that the productivity and impact of a research project cannot entirely be described through counts of publications and citations, even when normalized for scientific topic area, publication type and publication year. Projects may contribute to biomedical research in ways that are not captured by citation metrics. However, when examined across large numbers of investigators, these metrics do give us some useful information about trends to consider when making policy decisions.
Definitions
R01 projects: Research project grants.
New investigator: An individual who has not previously competed successfully as a program director/principal investigator for a substantial NIH independent research award (see http://grants.nih.gov/grants/glossary.htm#NewInvestigator).
Total cost: Sum of awarded direct and indirect costs for a grant period.
Interesting analysis Stefan. Do you think the differences could be driven by something very simple, namely that the PI does not consider submitting for a renewal if the grant work has not been very successful? In this case success is measured as number of publications. Based on your results above, particularly Fig. 2, it would appear that success for renewal correlates with the number of publications so it is not a good use of time to submit for renewal unless you have published well.
I suspect Kelvin is right in suggesting that submission of a T2 is suppressed when the metrics that portend it’s success are not available.
A more important question, I believe, is whether submission of a T2 is a useful measure of anything. I see no reason to believe that lack of a T2 application says anything negative about the value of the work in the original grant period. Work can be very valuable even if it does not lead to publications or other metrics of success.
I’ve had a string of one-off grants, as well as a grant that’s been renewed 3 times. In my opinion, being better informed about the work supported by those grants than anyone else, the 3x-renewed grant just happens to be the type of work that can look good at 4-year intervals, but it’s not nearly as exciting to me, nor does it have anywhere near the potential impact, of any of my one-off grants.
First, let me say really nice work, Stephan. Second, I find Dr. Singlestone’s comments quire cogent and suggest that they be discussion points for reviewers of MIRA renewal applications.
Hi Stephan. Have you looked at subsequent competing Type 1s for these formerly-new investigators? We looked at NIAID early established investigators (i.e. PIs coming to the end of their first R01) and found that 80% of their follow-on applications were for new Type 1s. We were surprised that only 20% were for renewal of their first R01. Also, have you looked at productivity and impact of first R01 recipients according to their priority or percentile scores (following Dr. Berg’s 2012 Nature report)? And, are there any differences in follow-on R01 success rates (Type 1 or 2) of first-time R01 recipients according to priority or percentile scores of their first R01 award? There is quite a bit of debate about the association between priority or percentile scores, and productivity, scientific impact, and subsequent success rates. Thanks!