
The Consolidated Appropriations Act, 2016, provides funding for the Federal Government through September 30. NIGMS has a Fiscal Year 2016 appropriation of $2.512 billion, which is $140 million, or 5.9%, higher than it was in Fiscal Year 2015. With this opportunity to expand NIGMS support for fundamental biomedical research comes a responsibility to make carefully considered investments with taxpayer funds.
Application Trends
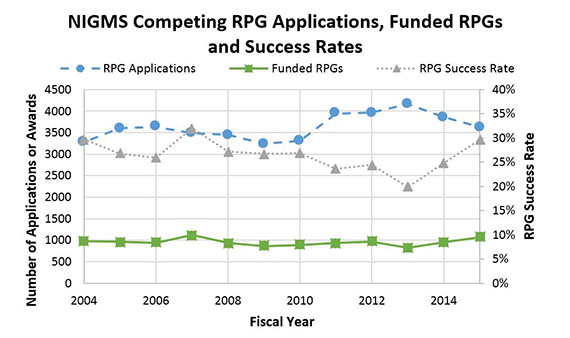
One of the most commonly cited metrics when discussing grants is success rate, calculated as the number of applications funded divided by the number of applications received. As shown in Figure 1, the success rate for NIGMS research project grants (RPGs) increased from 24.8% in Fiscal Year 2014 to 29.6% in Fiscal Year 2015. This was due to an increase in the number of funded competing RPGs as well as a decline in the number of competing RPG applications. In contrast, in Fiscal Year 2013, applications increased while awards decreased, leading to a notable decrease in success rate. Overall, we have seen a decrease in RPG applications over the last 2 years, a trend warranting additional investigation.
NIGMS is committed to sustaining a broad and diverse portfolio of research and researchers, and thus the decrease in applications could be a cause for concern if it presages a significant decline in the number of investigators conducting fundamental biomedical research. To begin to understand the reasons for this 2-year trend, we assessed the number of unique investigators submitting applications over the same time period. This was done because changes in application numbers do not necessarily correspond to changes in the number of investigators seeking NIGMS funding. For instance, an investigator who had been submitting multiple grant proposals per year might change strategy and only submit one proposal per year, resulting in a decrease in applications without a decrease in applicants.
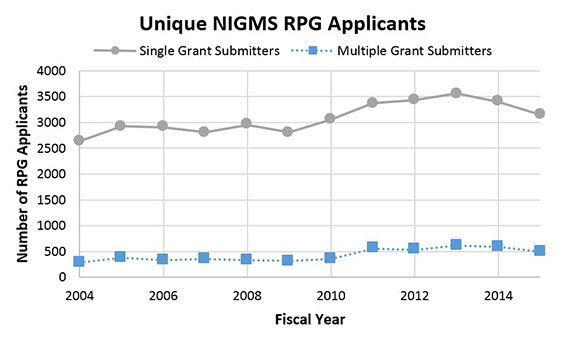
For this analysis, we grouped individuals into two categories: Those who submitted multiple unique grant applications in a year (“multiple grant submitters”) and those who submitted only one application in a year (“single grant submitters”). Single grant submitters constitute approximately 85-90% of the NIGMS RPG applicant pool, and a loss of any one application from this group of applicants potentially represents the loss of an investigator from the pool.
From Fiscal Years 2013 to 2015, there has been a decrease of approximately 400 yearly single grant submitters and approximately 100 yearly multiple grant submitters, as shown in Figure 2. It is important to note, however, that a yearly snapshot may not be the best metric, so in the future, we will be looking more closely at trends in the number of investigators who are funded by or seeking funding from NIGMS.
As noted above, changes in the numbers of both applications and awards contributed to the recent increases in success rate. The number of competing applications submitted is primarily driven by the research community, while the number of funded competing grants is affected by our funding policies, budget and existing commitments to active grants. As stated in our 2015 strategic plan, we have been making efforts to bolster support for investigator-initiated research through careful consideration of our portfolio and funding policies.
Funding Trends
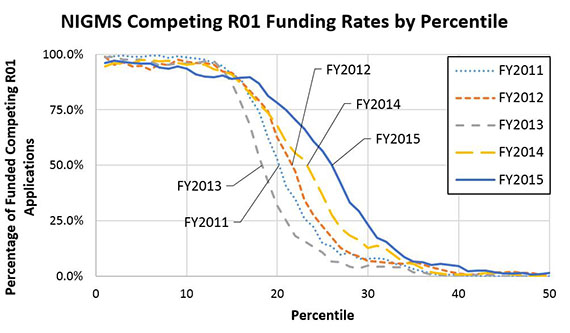
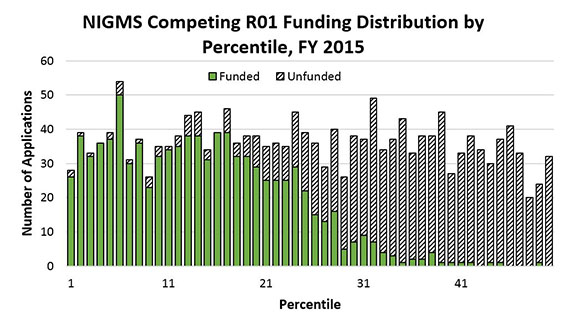
As often mentioned in our funding trends posts, we do not use a strict percentile cutoff to make funding decisions. Instead, we take a variety of factors into account, including peer review scores, the relevance of the research area to the Institute’s mission, overall portfolio diversity, and an applicant’s other research support. As a result, a significant number of applications each year are in the “fundable” range, as shown in the funding curves in Figure 3. For Fiscal Years 2013-2015, the percentile at which 50% of the applications were funded moved from 18 to 22 to 26, respectively, a trend that correlates with the increases in success rates shown in Figure 1. In addition, the curves were shallower in Fiscal Years 2014 and 2015, reflecting a wider “fundable” range for applications. This effect can also be seen in Figure 4, which demonstrates the relatively even distribution of percentiles for R01 applications as well as the wide “fundable” score range.
The overall success rate and shape of funding curves give an indication of the year-to-year outcomes of NIGMS funding policies but do not reflect how decisions in one year can influence future years. All of the figures shown to this point focus only on competing applications for each year, which generally represent only a quarter of our yearly investment in research. The other major component comes in the form of “out-year commitments”—noncompeting renewals of existing grants.
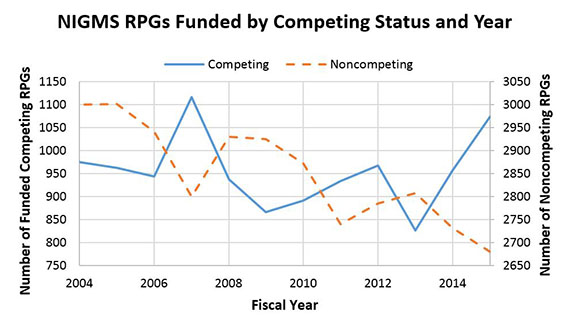
Most NIGMS grants are awarded with an anticipated number of years of support. These commitments generally last about 3 to 5 years. We almost exclusively give 4-year R01s, except when they’re for early stage investigators, who usually receive 5 years of support. Success rate calculations only concern competing applications, but the flow of grants between noncompeting and competing status affects both the number of received applications and the number of applications that can be funded. Figure 5 illustrates this point, with characteristic peaks in funded competing RPGs followed by troughs in competing awards alongside broader peaks in noncompeting awards. My 2014 post, Funding Trends and Factors Affecting Success Rate, describes some of the historical reasons for this peak-and-trough pattern.
From Fiscal Years 2014 to 2015, NIGMS received less than a 0.5% increase in budget. By focusing on supporting investigator-initiated RPGs, we were able to increase the number funded by 1.7%, with a 12% increase in funded competing RPGs. However, this increase in funded grants generates additional out-year commitments that need to be taken into account in developing future funding strategies.
Because of this, it is essential that we carefully manage the tradeoff between funding additional long-term competing awards and using new funds for high-impact, short-term purposes. Using the entirety of this year’s budget increase to fund RPGs with 4- and 5-year commitments could adversely affect our ability to fund additional competing applications in Fiscal Year 2017 and beyond because too much of our budget would be tied up in out-year commitments.
To help ensure we can maintain a healthy success rate in Fiscal Years 2017 and 2018, we will be using some of the new funds appropriated to us by Congress for grants with 1- or 2-year commitments. For example, we have just issued a funding opportunity announcement for equipment supplements, similar to the one we had last year. We also intend to support supplements to T32 training grants to allow curricular innovations, as a part of our effort to catalyze the modernization of biomedical graduate education. By carefully planning how we use the new funds, we hope to maintain a strong, steady success rate for investigator-initiated RPGs over the coming years.
Thanks to Jim Deatherage, Andrew Miklos, and Tony Moore for data contributions, and to Andrew Miklos for analyses and figures.
Sad that Congressional malfeasance requires you to effectively throw current money away on short-term low-impact nonsense instead of funding R01s because you are afraid of incurring too large out-year commitments and have to plan for the possibility that Congress will engage yet again in some ridiculous shenanigans like sequestration.
Great information. Is the NIH considering expanding the early career status to other mechanisms other than the RO1s?
We haven’t heard anything about expanding the ESI policy.
Would the total number of funded PIs (rather than applicants or awardees/year) be a better measure of whether the pool of investigators is shrinking?
That is one of the metrics we will be tracking as part of our strategic plan. We will also be tracking the number of PIs who are actively applying for grants. Please see A Shared Responsibility for some data on numbers of actively funded PIs.
It is long past time someone at NIH focused on the grant seeking behavior of individual PIs instead of merely tracking “success” by applications-submitted. For this you are to be congratulated. However, it is obvious that data from any one IC can only represent a misleading part of the full picture. PIs may seek funding from different ICs simultaneously or temporarily quit applying to one following a particularly dismal year, such as 2013 in your graphs. Those strategists might be expected to return quickly after the news about 2015 gets around. I would encourage you to push the Office of Extramural Research to pursue similar data analyses of per-investigator behavior across the entire NIH.
Many thanks for your thoughtful comment. We agree that it is important to study the grant-seeking behavior of individual PI’s across NIH. We at OER are in fact working on detailed analyses of the patterns and behaviors of scientists who apply for Research Project Grants. We are also examining trends over time. We hope to have some results posted on our Open Mike blog within the next few months.
Director Lorsch,
If we are losing talent, what are possible mechanisms for bringing such investigators back? Gaps in funding breed gaps in productivity, and these are viewed as deadly by study sections. It is not clear what could be done, given increasing demands for preliminary data and consistent productivity in the face of inconsistent funding dollars. The R21 mechanism does not, on paper, require preliminary data, though it appears that it is difficult to enforce this in review. GM does not generally support the R21, but something like this could be beneficial if there is desire to rehabilitate mid-career investigators that are falling by the wayside.