I recently posted several analyses (on July 15, July 19 and July 21) of the relationships between the overall impact scores on R01 applications determined by study sections and the criterion scores assigned by individual reviewers. These analyses were based on a sample of NIGMS applications reviewed during the October 2009 Council round. This was the first batch of applications for which criterion scores were used.
NIGMS applications for the October 2010 Council round have now been reviewed. Here I present my initial analyses of this data set, which consists of 654 R01 applications that were discussed, scored and percentiled.
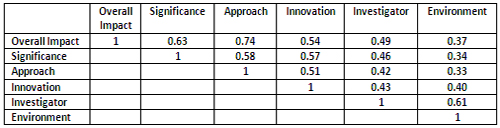
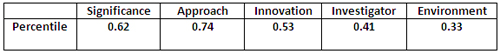
The first analysis, shown below, relates to the correlation coefficients between the overall impact score and the averaged individual criterion scores.
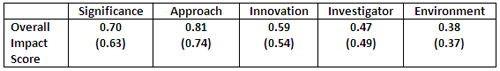
Correlation coefficients between the overall impact score and averaged individual criterion scores for 654 NIGMS R01 applications reviewed during the October 2010 Council round. The corresponding scores for a sample of 360 NIGMS R01 applications reviewed during the October 2009 Council round are shown in parentheses.
Overall, the trend in correlation coefficients is similar to that observed for the sample from 1 year ago, although the correlation coefficients for the current sample are slightly higher for four out of the five criterion scores.
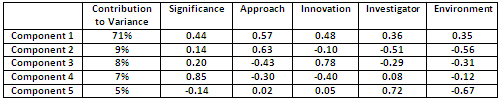
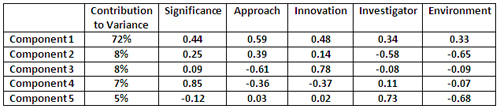
Here are results from a principal component analysis:
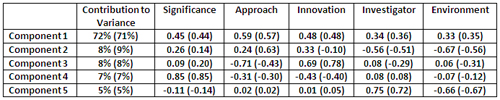
Principal component analysis of overall impact score based on the five criterion scores for 654 NIGMS R01 applications reviewed during the October 2010 Council round. The corresponding scores for a sample of 360 NIGMS R01 applications reviewed during the October 2009 Council round are shown in parentheses.
There is remarkable agreement between the results of the principal component analysis for the October 2010 data set and those for the October 2009 data set. The first principal component accounts for 72% of the variance, with the largest contribution coming from approach, followed by innovation, significance, investigator and finally environment. This agreement between the data sets extends through all five principal components, although there is somewhat more variation for principal components 2 and 3 than for the others.
Another important factor in making funding decisions is the percentile assigned to a given application. The percentile is a ranking that shows the relative position of each application’s score among all scores assigned by a study section at its last three meetings. Percentiles provide a way to compare applications reviewed by different study sections that may have different scoring behaviors. They also correct for “grade inflation” or “score creep” in the event that study sections assign better scores over time.
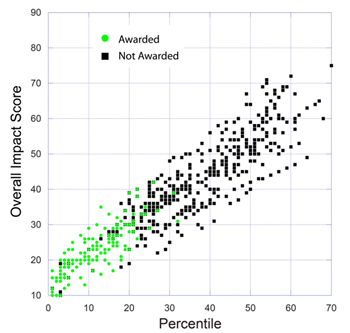
Here is a plot of percentiles and overall impact scores:

A plot of the overall impact score versus the percentile for 654 NIGMS R01 applications reviewed during the October 2010 Council round.
This plot reveals that a substantial range of overall impact scores can be assigned to a given percentile score. This phenomenon is not new; a comparable level of variation among study sections was seen in the previous scoring system, as well.
The correlation coefficient between the percentile and overall impact score in this data set is 0.93. The correlation coefficients between the percentile and the averaged individual criterion scores are given below:
Correlation coefficients between the percentile and the averaged individual criterion scores for 654 NIGMS R01 applications reviewed during the October 2010 Council round.
As one would anticipate, these correlation coefficients are somewhat lower than those for the overall impact score since the percentile takes other factors into account.
The results of a principal component analysis applied to the percentile data show:
Principal component analysis of percentile data based on the five criterion scores for 654 NIGMS R01 applications reviewed during the October 2010 Council round.
The results of this analysis are very similar to those for the overall impact scores, with the first principal component accounting for 72% of the variance and similar weights for the individual averaged criterion scores.
Our posting of these scoring analyses has led the NIH Office of Extramural Activities and individual institutes to launch their own analyses. I will share their results as they become available.


 NIH Director Francis Collins recently named Larry Tabak as the NIH principal deputy director. Raynard Kington previously held this key position.