As we work on issuing a new funding opportunity announcement (FOA) for the established investigator (EI) MIRA program, we thought it would be useful to address a few common questions we’ve been hearing. The new FOA will allow applications from NIGMS grantees who have one or more single-Principal Investigator (PI) R01-equivalent awards, just as the current FOA does. In addition, the new FOA (to be published by Fall 2019) will allow renewal applications from PIs who already have MIRA grants.
NIGMS has made MIRA awards to Established Investigators (EI) and Early-Stage Investigators (ESI) for three full Fiscal Years (FY). In this FeedbackLoop post, we provide an analysis of application, review, funding, and demographic trends for the MIRA program.
For the first two rounds of EI MIRAs, eligibility was limited to well-funded NIGMS investigators: PIs with two or more NIGMS R01-equivalent awards or one NIGMS R01-equivalent award for >$400,000 in direct costs. For the FY 2018 EI competition and beyond, eligibility was expanded to include any investigator with a single PD/PI NIGMS R01-equivalent that is up for renewal. For the FY 2016 ESI MIRA competition, ESIs and New Investigators (NI) at the assistant professor or equivalent level were eligible, whereas eligibility was restricted to ESIs in subsequent rounds. As always, a PI can apply for an extension of ESI status for various life and career events, including childbirth.
NIGMS is committed to ensuring that taxpayers get the best possible returns on their investments in fundamental biomedical research. As part of this commitment to stewardship, we regularly monitor trends in our funding portfolio.
We recognize the value of a diversified investment portfolio and approach our research investments in a similar fashion. Sustaining a broad and diverse portfolio of talented investigators is a central goal of the Institute, as a wide variety of research questions can be studied by an investigator pool that comprises many different backgrounds, fields, and skills. To monitor this, we track the “cumulative investigator rate,” which indicates the proportion of unique investigators actively seeking funding who had an NIGMS grant in a given Fiscal Year (FY). As shown in Figure 1, the number of investigators seeking support consistently increased between FY 2006 and 2014, but the number of NIGMS-funded investigators remained relatively unchanged over that same period. As a result, the cumulative investigator rate steadily decreased. Since FY 2014, the cumulative investigator rate has steadily increased, as the number of applicants seeking support has stabilized and the number of investigators receiving support has grown by 14%. Currently, 37.4% of investigators seeking R01/R35 funding from NIGMS received support in FY 2017.
Figure 1. Number of NIGMS R01/R35 Applicants, Awardees, and Cumulative Investigator Rates, FY 2006-2017. The number of investigators actively seeking NIGMS R01 and R35 support (blue circles, dashed line; left axis) increased steadily from FY 2006 to 2014 but has stabilized more recently. These applicants were defined as anyone who submitted a competing NIGMS R01 or R35 application in the fiscal year shown or any of the previous four fiscal years. The NIGMS R01 and R35 awardee counts (green squares, solid line; left axis) remained relatively stable from FY 2006 to 2014 and have increased somewhat over the past three years. As a result, the NIGMS cumulative investigator rate (gray triangles, dotted line; right axis) declined from FY 2006 to 2014 but has begun to recover since then.
One question that has been asked about the Maximizing Investigators’ Research Award (MIRA) for Early Stage Investigators is how awardees will be affected by the fact that they cannot have additional NIGMS research grants. In response to this question, we reviewed the research project grant (RPG) funding history of all 707 Principal Investigators (PIs) who received an NIGMS R01 as an Early Stage Investigator (ESI) between Fiscal Years 2009 and 2015. The PIs were grouped by Year of PI, which ranges from Year 1 to Year 5 (five years is the typical length of an ESI R01 award). Year 1 is the year in which the PI was awarded his or her initial R01, and Year 2-Year 5 represent the subsequent years. The awards and funding history of each PI were confined to Fiscal Years 2009-2015; thus, all PIs are included in the Year 1 group, while those who received their initial R01 in 2013, for example, would only appear in the Year 1-Year 3 groups.
The distribution of NIGMS awards (including subprojects) for these PIs is depicted below.
Figure 1. Percentage of Principal Investigators by Number of Active NIGMS Awards. Year 1 represents the year of the initial NIGMS R01; Year 2-Year 5 represent the subsequent years. Only Fiscal Years 2009-2015 are included. No PIs had more than three active NIGMS awards in a single year.
NIGMS is committed to ensuring that taxpayers get the best possible returns on their investments in fundamental biomedical research. As part of an NIH-wide commitment to enhancing stewardship, we regularly monitor trends in the Institute’s funding portfolio.
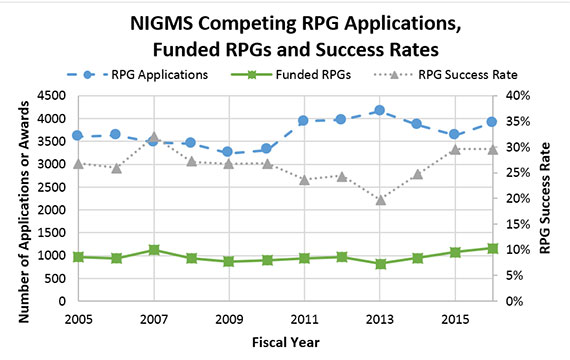
One of the most commonly cited metrics when discussing grants is success rate, calculated as the number of applications funded divided by the number of applications reviewed. As shown in Figure 1, the success rate for NIGMS research project grants (RPGs) was 29.6% in Fiscal Year (FY) 2016, the same as it was in FY 2015. Although we funded a record number of competing RPGs in FY 2016, we also received more applications than in FY 2015, leading to a level success rate. The first applications and grants for the Maximizing Investigators’ Research Award (MIRA) (R35) program are included in the FY 2016 RPG counts. The increase in RPG applications in FY 2016 has reversed the downward trend noted in last year’s analysis.
Figure 1. Number of NIGMS Competing RPG Applications, Number of Funded Competing RPGs and Success Rates for RPGs, Fiscal Years 2005-2016. NIGMS RPG applications (blue circles, dashed line; left axis) increased from FY 2015-2016. NIGMS-funded RPGs (green squares, solid line; left axis) also increased from FY 2015-2016. Consequently, the NIGMS RPG success rate (gray triangles, dotted line; right axis) remained unchanged from FY 2015. The dip in success rate in FY 2013 was due in part to the budget sequester.
We have published median and mean direct cost award amounts for R01 grants, but these statistical aggregates can mask variations present in our grant portfolio. In this analysis, we illuminate two major differences in R01 award size distributions: those between single-principal investigator (PI) and multiple-PI (MPI) grants and those between new and competing renewal grants. It is worth noting that the numbers are per award values rather than the total NIGMS support provided to investigators and that award size can also be influenced by NIH-wide policies and NIGMS-specific policies that promote the consideration of multiple factors in making funding decisions.
The first major distinction in NIGMS R01s exists between single-PI and MPI awards. NIH has allowed applications that identify more than one PI since Fiscal Year 2007. Many MPI applications request, and receive, larger amounts of funding than do typical single-PI applications. As shown in Figure 1, single-PI awards have a size peak in the range of $175,000-200,000 in direct costs (funds typically directly associated with the research project rather than overhead costs), while MPI awards tend to have larger budgets and a broader size distribution. MPI awards are, on average, approximately 25% larger for each additional PI (data not shown).
The Consolidated Appropriations Act, 2016, provides funding for the Federal Government through September 30. NIGMS has a Fiscal Year 2016 appropriation of $2.512 billion, which is $140 million, or 5.9%, higher than it was in Fiscal Year 2015. With this opportunity to expand NIGMS support for fundamental biomedical research comes a responsibility to make carefully considered investments with taxpayer funds.
Application Trends
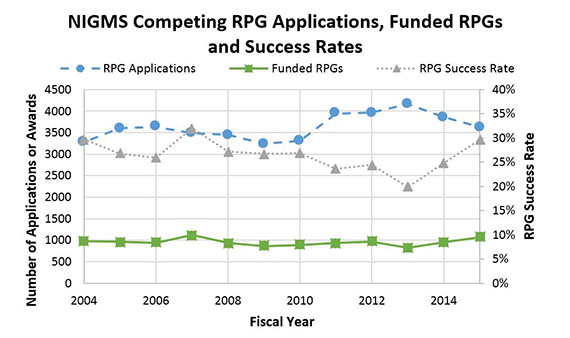
One of the most commonly cited metrics when discussing grants is success rate, calculated as the number of applications funded divided by the number of applications received. As shown in Figure 1, the success rate for NIGMS research project grants (RPGs) increased from 24.8% in Fiscal Year 2014 to 29.6% in Fiscal Year 2015. This was due to an increase in the number of funded competing RPGs as well as a decline in the number of competing RPG applications. In contrast, in Fiscal Year 2013, applications increased while awards decreased, leading to a notable decrease in success rate. Overall, we have seen a decrease in RPG applications over the last 2 years, a trend warranting additional investigation.
Figure 1. Number of NIGMS Competing RPG Applications, Funded Competing RPGs and Success Rates for RPGs, Fiscal Years 2004-2015. NIGMS RPG applications (blue circles, dashed line; left axis) decreased from Fiscal Years 2014 to 2015 to a 5-year low. Meanwhile, NIGMS-funded RPGs (green squares, solid line; left axis) increased in Fiscal Year 2015 to a level not seen since Fiscal Year 2007. As a result, the NIGMS RPG success rate (gray triangles, dotted line; right axis) was the second highest it has been in the past decade.
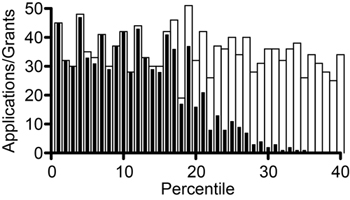
Fiscal Year 2010 ended on September 30, 2010. We have now analyzed the overall results for R01 grants, shown in Figures 1-3.
Figure 1. Competing R01 applications reviewed (open rectangles) and funded (solid bars) in Fiscal Year 2010.
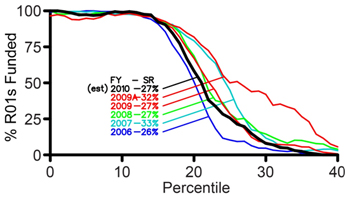
Figure 2. NIGMS competing R01 funding curves for Fiscal Years 2006-2010. The thicker curve (black) corresponds to grants made in Fiscal Year 2010. The success rate for R01 applications was 27%, and the midpoint of the funding curve was at approximately the 21st percentile. These parameters are comparable to those for Fiscal Year 2009, excluding awards made with funds from the American Recovery and Reinvestment Act.
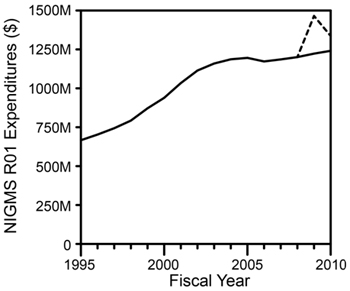
The total NIGMS expenditures (including both direct and indirect costs) for R01 grants are shown in Figure 3 for Fiscal Year 1996 through Fiscal Year 2010.
Figure 3. Overall NIGMS expenditures on R01 grants (competing and noncompeting, including supplements) in Fiscal Years 1995-2010. The dotted line shows the impact of awards (including supplements) made with Recovery Act funds. Results are in actual dollars with no correction for inflation.
What do we anticipate for the current fiscal year (Fiscal Year 2011)? At this point, no appropriation bill has passed and we are operating under a continuing resolution through March 4, 2011, that funds NIH at Fiscal Year 2010 levels. Because we do not know the final appropriation level, we are not able at this time to estimate reliably the number of competing grants that we will be able to support. We can, however, estimate the number of research project grant applications in the success rate base (correcting for applications that are reviewed twice in the same fiscal year). We predict that this number will be approximately 3,875, an increase of 17% over Fiscal Year 2010.
UPDATE: The original post accidentally included a histogram from a previous year. The post now includes the correct Fiscal Year 2010 figure.
My previous post generated interest in seeing the results coded to identify new investigators and early stage investigators. Recall that new investigators are defined as individuals who have not previously competed successfully as program director/principal investigator for a substantial NIH independent research award. Early stage investigators are defined as new investigators who are within 10 years of completing the terminal research degree or medical residency (or the equivalent).
Below is a plot for 655 NIGMS R01 applications reviewed during the January 2010 Council round.
A plot of the overall impact score versus the percentile for 655 NIGMS R01 applications reviewed during the January 2010 Council round. Solid symbols show applications for which awards have been made and open symbols show applications for which awards have not been made. Red circles indicate early stage investigators, blue squares indicate new investigators who are not early stage investigators and black diamonds indicate established investigators.
This plot reveals that many of the awards made for applications with less favorable percentile scores go to early stage and new investigators. This is consistent with recent NIH policies.
The plot also partially reveals the distribution of applications from different classes of applicants. This distribution is more readily seen in the plot below.
A plot of the cumulative fraction of applications for four classes of applications with a pool of 655 NIGMS R01 applications reviewed during the January 2010 Council round. The classes are applications from early stage investigators (red squares), applications from new investigators (blue circles), new (Type 1) applications from established investigators (black diamonds) and competing renewal (Type 2) applications from established investigators (black triangles). N indicates the number in each class of applications within the pool.
This plot shows that competing renewal (Type 2) applications from established investigators represent the largest class in the pool and receive more favorable percentile scores than do applications from other classes of investigators. The plot also shows that applications from early stage investigators have a score distribution that is quite similar to that for established investigators submitting new applications. The curve for new investigators who are not early stage investigators is similar as well, although the new investigator curve is shifted somewhat toward less favorable percentile scores.