
NIGMS’ Maximizing Investigators’ Research Award (MIRA) provides investigators with flexibility and stability for their research programs. Investigators who receive MIRA support must dedicate 51% of their research effort toward the grant and are ineligible to apply for or receive other NIGMS research support (with some exceptions). One question frequently asked is whether the NIGMS funding restriction changes the likelihood that MIRA grantees will submit applications to other NIH institutes and centers (ICs). In this post, we compare data on post-award grant applications from NIGMS-funded investigators.
To compare application behavior between MIRA and R01-funded investigators, we created sets of both established (EI) and early stage (ESI) investigators supported by NIGMS R01s (called the comparator group) who have not received a MIRA. The EI comparators were matched according to race/ethnicity, gender, time since acquisition of first R01, and average annual NIGMS funding. For the ESI comparator group, we used all ESI NIGMS R01 awardees.
Post-Award Applications
As a first step, we looked at the proportion of principal investigators (PIs) in each of these groups who submitted at least one research grant application to an IC other than NIGMS after receiving their MIRA (or comparable R01 award). Since NIGMS MIRA awardees can’t apply for additional NIGMS research grants, which include research project and research center grants, we focused our analyses on these grant types, specifically on the two largest categories, research project grants (RPGs) and research center grants.
Figure 1 splits investigators by the year of their MIRA (or comparable R01) grant and plots the proportion within each cohort that had at least one application to another IC. The data show that for almost every cohort, the proportion is lower for MIRA investigators than for the comparator R01 group, a finding that is true for both EIs and ESIs. The other clear trend is that the proportion of post-award applications to other ICs decreases over time for all groups. This is likely due to the later cohorts having less time to submit additional applications. Even within these later cohorts, the proportions are generally smaller for MIRA PIs than for the comparator groups.
Percentage of PIs With Post-Award Applications
Type 1/2 Applications; Includes RPGs and Research Center Grants
Figure 1: Percentage of PIs With Post-Award Applications. These line graphs illustrate the percentage of investigators in each group with post-award applications to NIH ICs other than NIGMS by cohort. The solid purple lines show the percentage for EI MIRA investigators was 50% in the Fiscal Year (FY) 2016 cohort and 25% for the FY 2020 cohort, while for ESI MIRAs, it was 61% for the FY 2016 cohort and 40% for the FY 2020 cohort. The green dashed lines show the percentage of EI comparator investigators with applications to other ICs was 76% for the FY 2016 cohort and approximately 36% for the FY 2020 cohort, and over 80% for the ESI comparator investigators in the FY 2016 cohort and 38% in the FY 2020 cohort.
Applications to Other ICs
We next examined the number of applications to ICs other than NIGMS for both MIRA and comparator PIs. As a first step, we compared the number of post-award applications to non-NIGMS ICs for each PI by cohort. Figure 2 shows that for almost every cohort, MIRA PIs have submitted fewer post-award applications to other ICs than comparator PIs, and this is true for both EIs and ESIs. Even excluding investigators with no post-award applications to other ICs, we still see a difference.
Post-Award Non-NIGMS Applications Per PI
Includes Type 1/2 RPGs and Research Center Grants
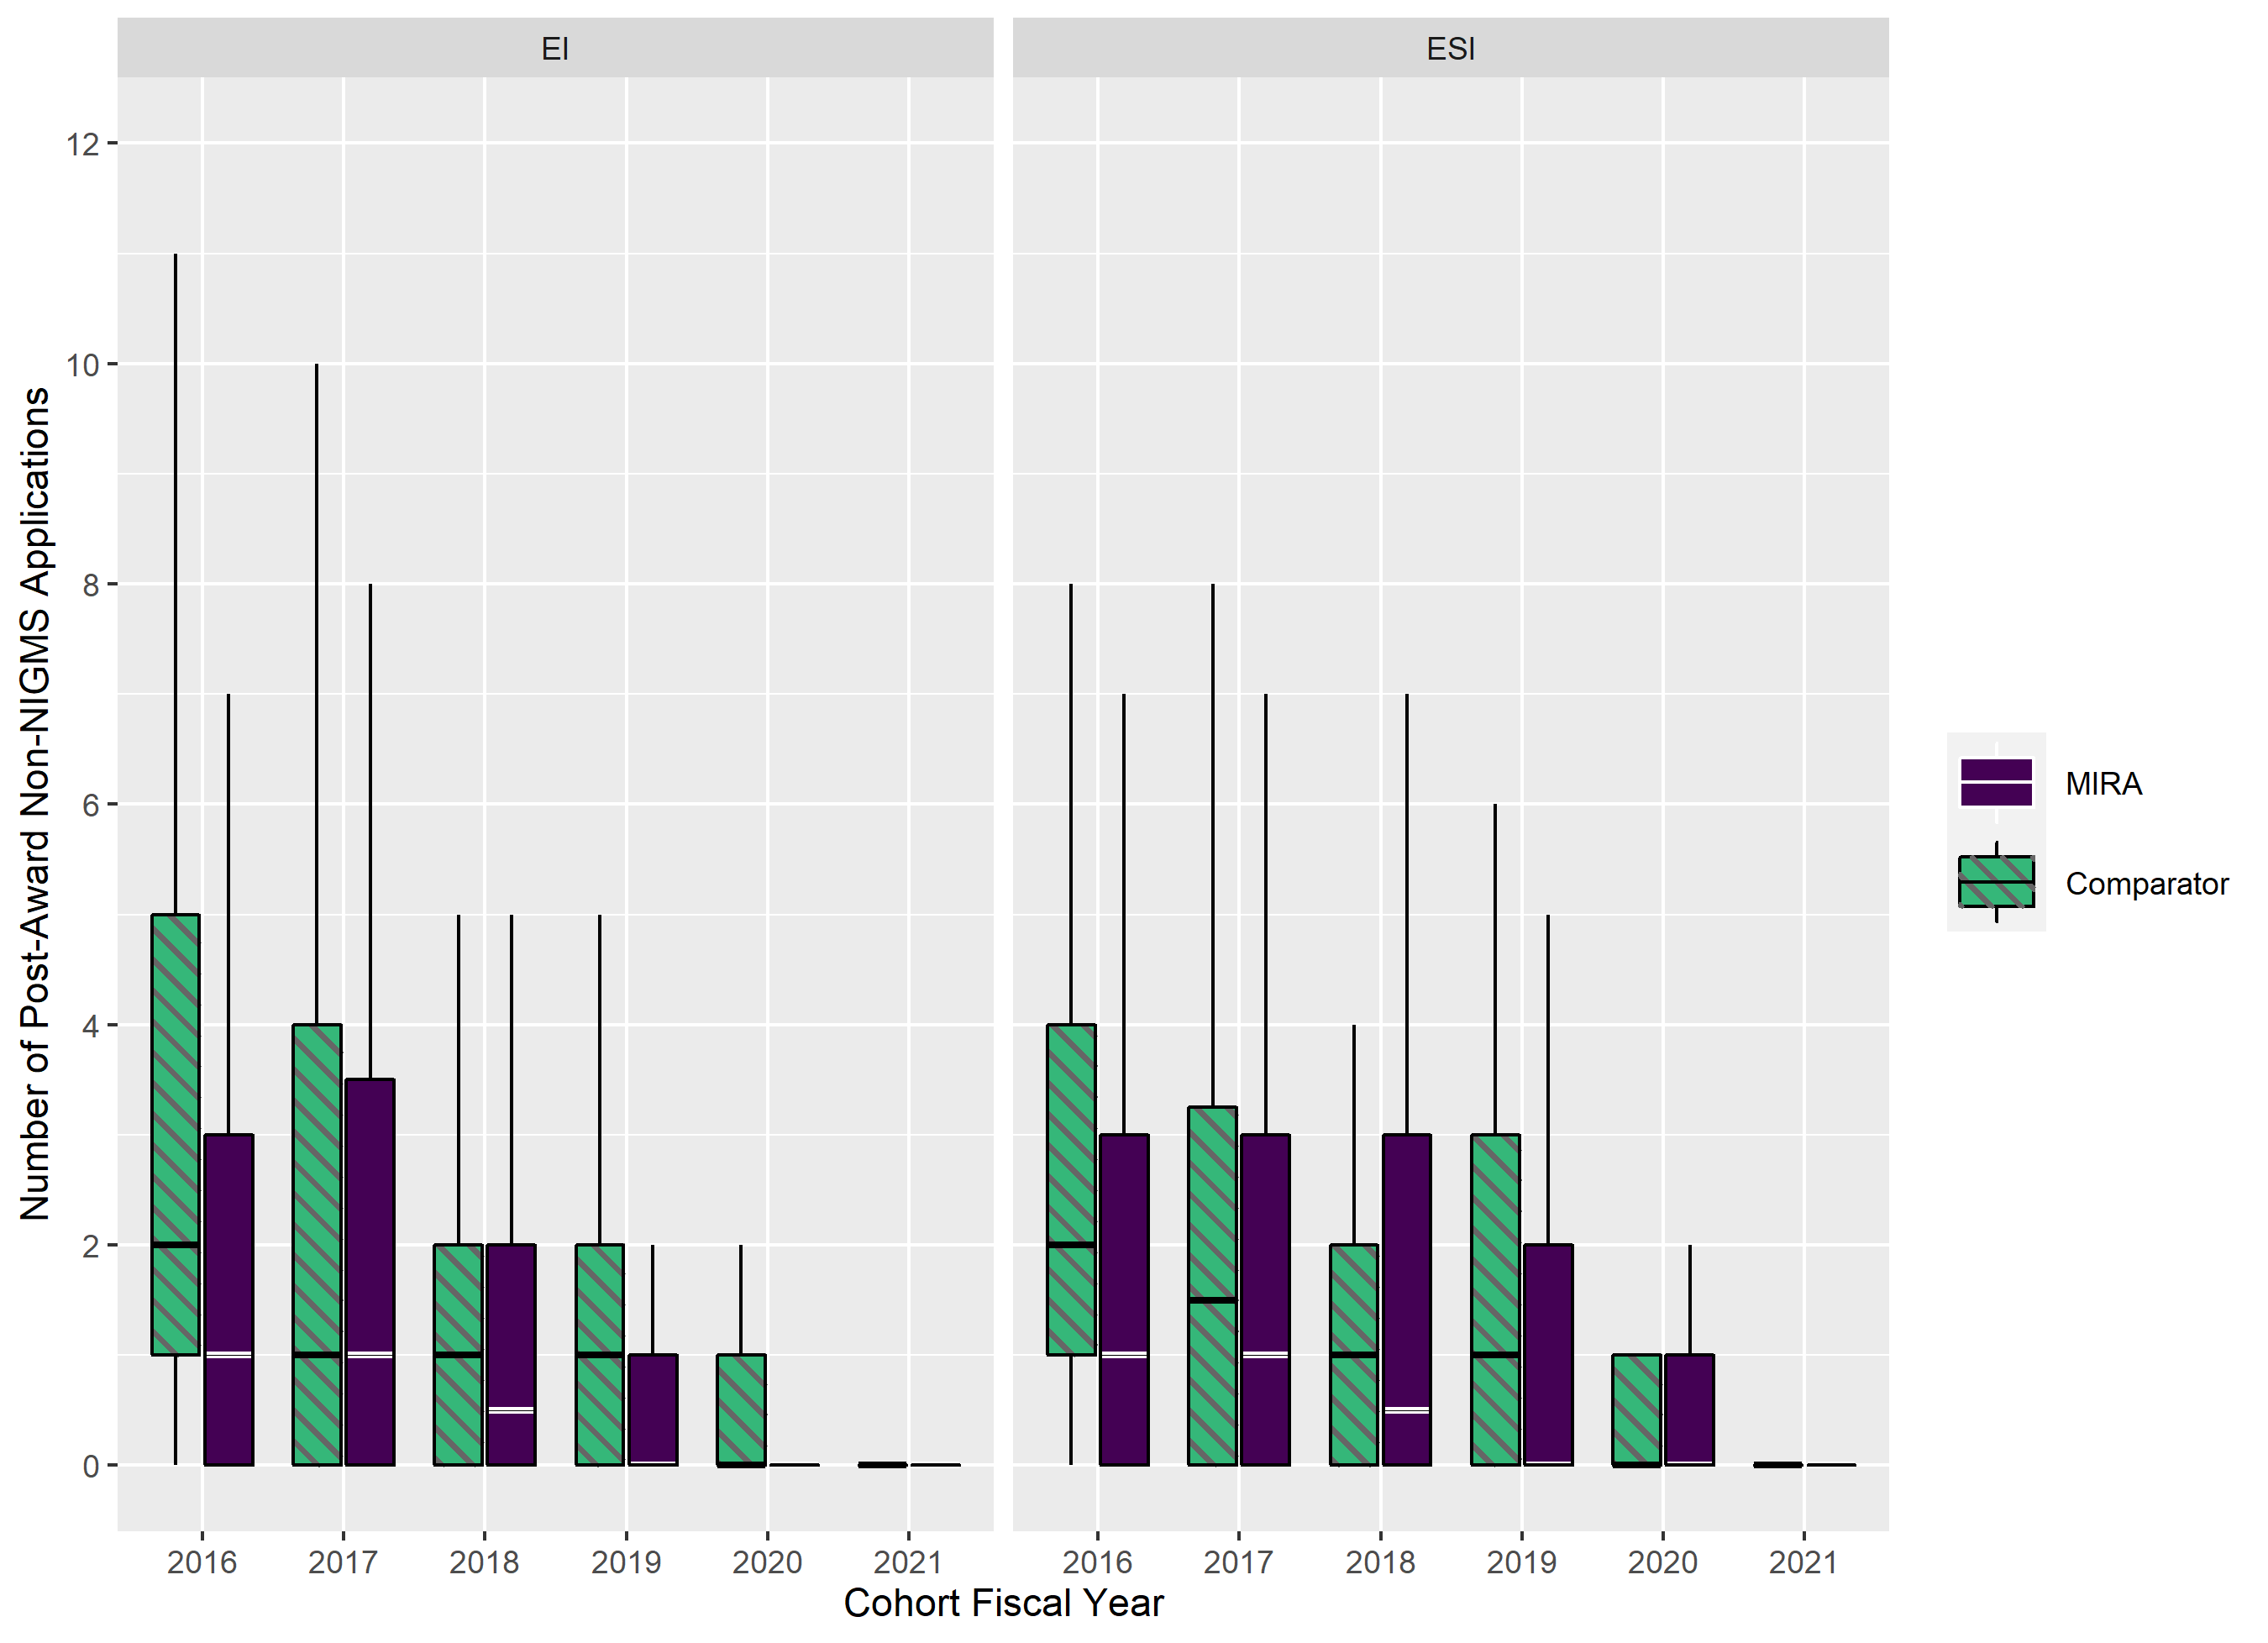
Figure 2: Post-Award Non-NIGMS Applications Per PI. Box plots show post-award RPG and center grant application submissions to other ICs from MIRA (solid purple bars) and R01 comparator (striped green bars) PIs by the year their NIGMS grants were received. The horizontal line in each bar represents the median number of applications for the group. The top and bottom of each bar represents the 75th and 25th percentiles, respectively. Whiskers below the bar show application numbers that are less than the 25th percentile while whiskers above it show those that are greater than the 75th percentile. The data reflect FY 2016 up to the end of FY 2021.
To assess this relationship more robustly, we performed a regression analysis to model the count of post-award applications to other ICs, which allowed us to control for other potentially influential variables, such as the proportion of a PI’s prior applications going to non-NIGMS ICs and the size of the NIGMS MIRA or comparable R01 grant.
The results of our regression analysis support the findings from Figure 2. The difference between MIRA PIs and comparator PIs is statistically significant (p = 0.0001), with MIRA PIs associated with fewer post-award applications to non-NIGMS ICs. We also find that ESIs from both groups tend to have more post-award applications to non-NIGMS ICs than EIs (p < 0.0001). The strongest predictor of applications to non-NIGMS ICs, though, is the proportion of a PI’s prior applications that went to non-NIGMS ICs (p < 0.0001), which suggests that investigators who historically applied elsewhere continue to do so after receiving an NIGMS award. The size of the NIGMS MIRA or comparable R01 grant is also positively correlated with additional post-award applications to ICs other than NIGMS (p = 0.001). This effect appears to be driven largely by PIs with awards in the $500,000-$750,000 total cost range.
These findings are robust to alternative model specifications and model types, such as difference-in-difference and logistic regression models.
Conclusion
We find that MIRA grantees have fewer applications to ICs other than NIGMS relative to R01 grantees. This aligns with one of the goals of the MIRA program, to reduce the time awardees spend writing grant applications, allowing them to focus their attention on important scientific research.
What are the Ns for Figure 1?
The cohorts for FY 2016-2018 are around 100 investigators, and for FY 2019 and FY 2020 are 150-200 investigators.
I think we should consider the differences between PIs in the medical schools versus those in science departments (colleges). Medical school PIs are more likely to connect their research to other ICs in addition to NIGMS. Meanwhile, Medical school PIs are more resistant to converting their R01 grants to R35. In the typical situation, Medical school PIs have to pay a large chunk of their own salaries, and contributing 51% effort (but only getting $250k per year direct cost) will not work well for them. I understand that it is possible to request a higher budget for R35, but typically you don’t get a large budget from NIGMS. For Medical school PIs , 51% effort needs to bring in ~$400k direct cost, in order to run the lab and perform research.