
The Consolidated and Further Continuing Appropriations Act, 2015, provides funding for the Federal Government through September 30. NIGMS has a Fiscal Year 2015 appropriation of $2.372 billion, which is $13 million, or 0.5%, higher than it was in Fiscal Year 2014.
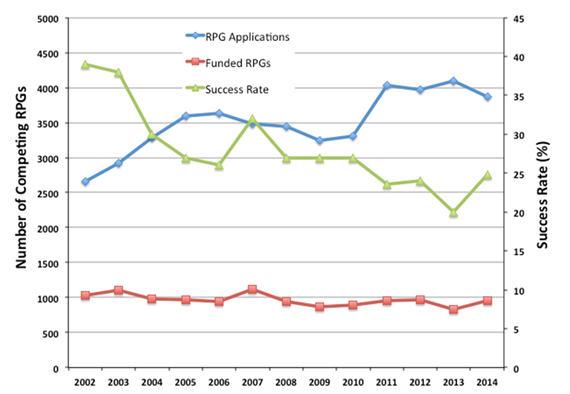
As I explained in an earlier post, we made a number of adjustments to our portfolio and funding policies last fiscal year in order to bolster our support for investigator-initiated research. Partly because of these changes, the success rate for research project grants (RPGs)—which are primarily R01s—was 25 percent in Fiscal Year 2014. This is 5 percentage points higher than it was in Fiscal Year 2013. Had we not made the funding policy changes, we predicted that the success rate would have remained flat at 20 percent.
Figure 1 shows the number of RPG applications we received and funded, as well as the corresponding success rates, for Fiscal Years 2002-2014.
Moving forward, it will be important to employ strategies that will enable us to at least maintain this success rate. In keeping with this goal, we recently released a financial management plan (no longer available) that continues many of the funding policies we instituted last year. As funds from the retirement of the Protein Structure Initiative come back into the investigator-initiated RPG pool, we’ll be working to ensure that they support a sustained improvement in success rate rather than create a 1-year spike followed by a return to lower rates.
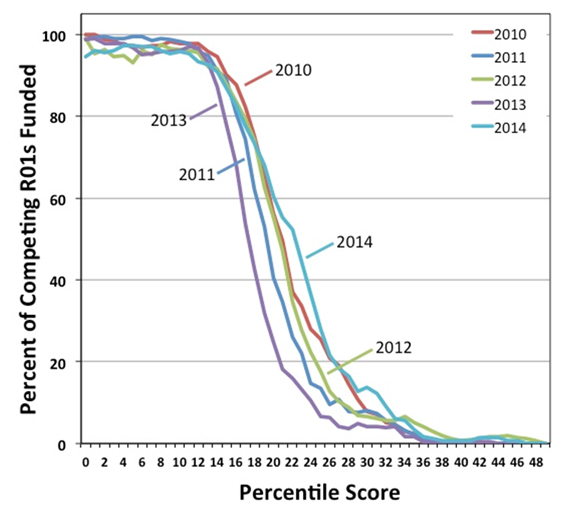
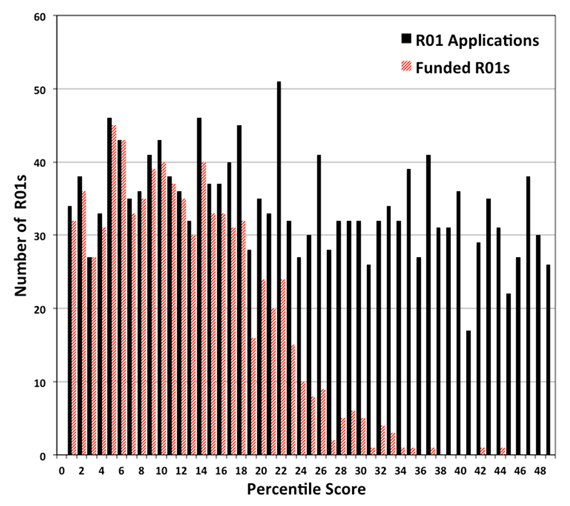
Figures 2 and 3 show data for funding versus the percentile scores of the R01 applications we received. People frequently ask me what NIGMS’ percentile cutoff or “payline” is, but it should be clear from these figures that we do not use a strict percentile score criterion for making funding decisions. Rather, we take a variety of factors into account in addition to the score, including the amount of other support already available to the researcher; the priority of the research area for the Institute’s mission; and the importance of maintaining a broad and diverse portfolio of research topics, approaches and investigators.
It’s too early to say what the success rate will be for Fiscal Year 2015 because it can be influenced by a number of factors, as I described last year. However, we’re hopeful that by continuing to adjust our priorities and policies to focus on supporting a broad and diverse portfolio of investigators, we can reverse the trend of falling success rates seen in recent years.
Bravo and Thank You Jon Lorch! The new Assistant Faculty I mentor recently received a good score on her A1 in a notoriously tough study section and the word from her PO is very encouraging. Not too long ago this good score would not have been enough, but now, thanks to your leadership an excellent score is in the strong running, exactly where it should be! And an outstanding young scientist has the opportunity to really get started with science instead of rewriting and repackaging grants & playing Russian Roulette with submission after submission, hoping to get the 3 reviewers that will put her into the top 10% .Yours is exactly the kind of leadership we need at NIH!! Thank you.
Jon, I am very impressed with all the hard work and serious thinking you have done to improve application success rates. Recent years have been demoralizing for many of us, but your leadership and new initiatives provide a little ray of hope that the worst may be over.
Very encouraging news about the increase in project support in 2014
Outstanding job, Jon! Keep up the great work.
This is wonderful news – thank you, Jon.
Congrats Jon! This is fabulous news!
Paul
Of course it sounds good that success rates are have risen from
20% to 25%. Yet I have heard several of the following stories recently. A grant
from investigator Jones receives a very high score, and NIGMS funds it. However, when they fund it, they cut the budget so extremely that an entire component
of the project is excised, which corresponds to an entire subcontract to
investigator Smith. Thus, Smith has just lost a grant. But that frees up extra
funds to fund a grant by investigator Brown. So have success rates really
risen? Dr. Smith does not think so. A collaborative effort has just been
destroyed. It sounds like a zero-sum game to me, and perhaps a lower-scoring
project has been funded at the expense of a part of a higher scoring project.
I would like to provide a different perspective on this post and the previous one from
Dr. Lorsch. Regarding his statement from the previous post that “when research labs
get too big … it creates inefficiencies. Much of the problem is one of bandwidth: One person can effectively supervise, mentor and train a limited number of people.” This line of
thought conflates size with budget. Large grants can fund very large staff sizes (if the
staff are cheap: students), and large grants can fund modest staff sizes if the staff are
professionals, such as at research institutes. So I agree the bandwidth issue does apply
for labs with 50 students, but I disagree for a lab with 15 PhD or other post-graduate
professionals, who need less supervision and are vastly more productive than students. Not to mention the fact that managerial ability plays a huge role and is ignored here.
Also from the earlier post: “a 2010 analysis by NIGMS and a number of subsequent studies of other funding systems have shown that, on average, large budgets do not give
us the best returns on our investments in basic science.” In my opinion, these analyses are
extremely superficial and flawed — I am sad to see federal policies being made on the basis of simplistic publication counting, which assumes all publications are equal, which is obviously not the case. I would argue that small projects often give rise to “least publishable units” with negligible impact. I see no evidence that small groups are more efficient than large groups.
And although I am glad to see an acknowledgment by Dr. Lorsch that “certain kinds of projects … such as clinical trials … do require large teams”, I see no attempt to fold this thinking into policy. What is the full range of kinds of projects that require large teams? Because under the “one size fits all” scheme being implemented now by NIGMS, those projects, and the health challenges that they represent, are being eviscerated.
I am sad when I see ego and success equated with lab size and money. But I am equally sad when I see extremely productive people (especially in fields where there are clear metrics for success) throttled back by a one size fits all policy that is far too simplistic (I do appreciate the challenges in trying to be fair).
I think a big part of the problem is that standard university policy puts all philanthropic funding into buildings and not people, a model that is neither humane nor sustainable.
this is great news.Very encouraging news for me.
thank you jon
This is really interesting data. Do you know if similar data exists for R15s at NIAID?