
NIGMS is committed to ensuring that taxpayers get the best possible returns on their investments in fundamental biomedical research. As part of an NIH-wide commitment to enhancing stewardship, we regularly monitor trends in the Institute’s funding portfolio.
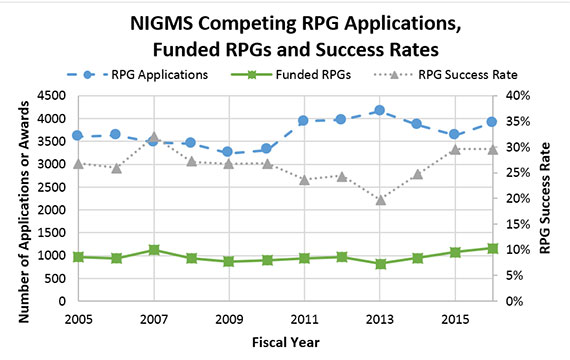
One of the most commonly cited metrics when discussing grants is success rate, calculated as the number of applications funded divided by the number of applications reviewed. As shown in Figure 1, the success rate for NIGMS research project grants (RPGs) was 29.6% in Fiscal Year (FY) 2016, the same as it was in FY 2015. Although we funded a record number of competing RPGs in FY 2016, we also received more applications than in FY 2015, leading to a level success rate. The first applications and grants for the Maximizing Investigators’ Research Award (MIRA) (R35) program are included in the FY 2016 RPG counts. The increase in RPG applications in FY 2016 has reversed the downward trend noted in last year’s analysis.
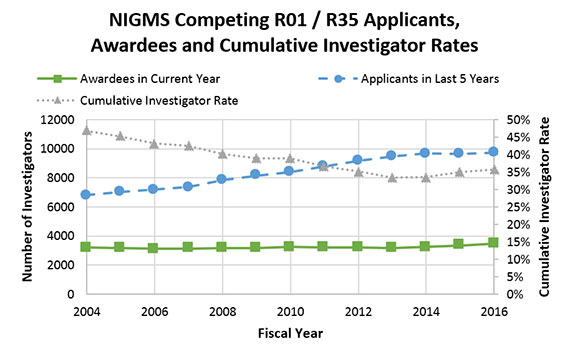
An alternative measure of the performance of our funding strategies and the health of our portfolio is the “cumulative investigator rate,” which indicates the proportion of investigators actively seeking funding who had at least one NIGMS grant in a given fiscal year. Figure 2 shows the number of investigators seeking NIGMS support increased by 40% between FY 2004-2014, but the number of NIGMS-funded principal investigators (PIs) remained relatively unchanged over that same period. As a result, the cumulative investigator rate steadily decreased. More recently, the cumulative investigator rate has increased slightly, as the number of applicants seeking support in FY 2013-2016 has stabilized and the number of PIs receiving support during this same period has grown by 10%.
As noted above, changes in the numbers of both competing applications and awards influence our success rate. The number of competing applications submitted is primarily driven by the research community, while the number of funded competing grants is affected by our funding policies, budget and existing commitments to active grants. As stated in our 2015 strategic plan, we have been making efforts to bolster support for investigator-initiated research through careful consideration of our portfolio and funding policies.
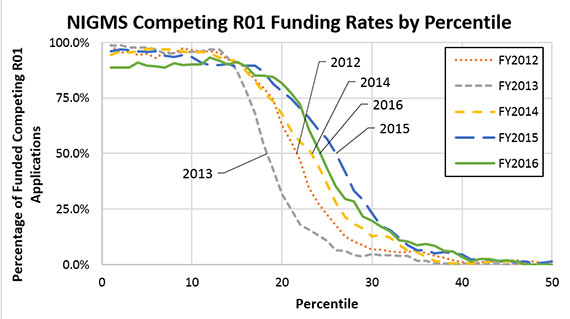
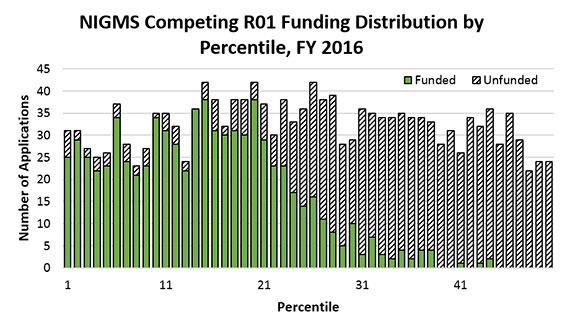
We’ve mentioned in previous funding trends posts that NIGMS does not use a strict percentile cutoff (“payline”) to make funding decisions. Instead, we take a variety of factors into account, including peer review scores, summary statements and reviews, the relevance of the research area to the Institute’s mission, overall portfolio diversity and an applicant’s other research support. The funding curves in Figure 3 show a significant number of applications each year are in the “fundable” range. In FY 2016, for example, NIGMS funded approximately 50% of applications that scored at the 24th percentile. This marks a drop from the 26th percentile in FY 2015, but it is higher than in any of the previous three years. Figure 4 displays the substantial percentile range of funded NIGMS competing R01s. It does not reflect data from the MIRA program, which is still in its early phases. NIGMS has been carefully monitoring the MIRA program and communicating its findings in separate Feedback Loop posts.
NIGMS is currently operating under a continuing resolution through April 28, meaning that the Institute’s budget is at a level similar to what it was in FY 2016. If the budget is flat for the remainder of FY 2017, we do not anticipate being able to maintain a success rate for RPGs as high as it has been over the past two years. However, as mentioned in last year’s funding trends post, NIGMS pursued a strategy in FY 2016 that included funding a balance of long-term and short-term awards. Because the funds from these short-term awards became available again this year, NIGMS should be able to support more competing grants in FY 2017 than would have been possible had we not implemented this funding strategy in FY 2016.
Moving forward, we will continue to use every available analytical tool to ensure that we maximize returns on the taxpayers’ investments by supporting a vibrant and diverse portfolio of outstanding fundamental biomedical research.
Thanks for sharing this information.
Very helpful!