
NIGMS funded its first round of renewals for the Maximizing Investigators’ Research Award (MIRA) program in Fiscal Year (FY) 2021. In this post, we compare data on the award rates and award sizes of MIRA renewals and R01 renewals to provide some insights into the early outcomes of MIRA renewals. We also examine award rates and budget changes for investigators applying to convert their NIGMS R01s to MIRAs.
In the first section, we present award rates (the percentage of reviewed applications that receive funding), considering both programs overall and then FY 2021 renewal applications specifically. The second section describes the award sizes for the two types of grants collectively, followed by award size changes for FY 2021 renewals. Where sample sizes and privacy concerns allow, we distinguish between established investigators (EIs) and early stage investigators (ESIs) renewing their first grants (“ex-ESIs”) as they often have different characteristics for award rates and sizes. All budget values shown in the post are yearly direct costs.
Table 1 shows summary highlights of these renewal award rate and budget change data. MIRA renewals had higher award rates and budget increases than R01 renewals. The R01-to-MIRA conversion rate was also higher than the R01 renewal rate, and conversions received the largest percentage budget increases for principal investigators (PIs) with less than $400,000 in prior annual funding. Budget cuts predominantly applied to investigators with at least $400,000 in prior funding.
| Cohort | Renewal/ Conversion Rates | Funding Change Median % | |||||
|---|---|---|---|---|---|---|---|
| Cohort-Wide | Cohort-Wide | Career Stage | Prior Funding | ||||
| ex-ESI | EI | <$200k | >= $200k, <$400k | >= $400k | |||
| R01 Renewal | 45.3% | 3.0 | 6.5 | 3.0 | 6.5 | 3.0 | -0.8 |
| R35 Renewal | 86.0% | 3.0 | 8.3 | 3.0 | 27.6 | 4.7 | 3.0 |
| R01/R35 Conversion | 52.0% | 14.1 | 19.3 | 11.1 | 28.2 | 11.1 | -10.7 |
Table 1. Renewal rates and funding changes. Renewal rates were 45.3% for R01 renewals, 86.0% for MIRA, and 52.0% for R01/MIRA conversions. Median budget increases were 3.0% for both renewals and 14.1% for R01/MIRA conversions. Median renewal budget changes were higher for ex-ESIs than EIs in all three cohorts (6.5% vs. 3.0% for R01 renewals, 8.3% vs. 3.0% for MIRA renewals, and 19.3% vs. 11.1% for R01/MIRA conversions). Those with less than $200,000 in prior funding received larger increases while those with at least $400,000 in prior funding were the most likely to receive cuts.
Award Rates: MIRA and R01 Overall
Because EI MIRA applicants currently must have at least one single-PI, NIGMS R01-equivalent grant to be eligible for the program, EI MIRA award rates for new (type 1) grants should be compared to R01 renewal (type 2) award rates. Compared to EIs renewing their R01s, the EI MIRA program has had a higher award rate since its inception (Figure 1). This difference was largest in the first 2 years of the program, which only accepted EI applications from NIGMS investigators holding either two NIGMS R01 grants or one R01 grant of more than $400,000 in annual direct costs. As EI eligibility for the MIRA program expanded in FY 2017, the award rate fell to 50%, 4 percentage points higher than that of R01 renewals, a gap that has since widened to 16 percentage points in FY 2021 (61% vs. 45%).
Figure 1. Established Investigator Award Rates. The award rate for new (type 1; T1) EI R01s was 21% for 5 out of 6 years from FY 2015 to FY 2020 before falling to 17% in FY 2021. The renewal (type 2; T2) EI R01 award rate ranged from 41% in FY 2016 to 51% in FY 2019, ending in FY 2021 at 45%. The new (T1) EI MIRA award rate was 76% initially, fell to 50% after 2 years, and has rebounded to 61% in FY 2021.
Consistent with NIGMS’ commitment to supporting early career scientists, T1 R01 applications from ESIs had award rates above those of T1 R01 applications from EIs from FY 2015 to FY 2019 (Figure 2). ESIs applying for MIRA in the first 2 years of the program received awards for 29% of applications; that award rate then increased and has been stable at 42% since FY 2019. After FY 2019, the award rate for ESI R01s declined.
Figure 2. Early Stage Investigator Award Rates. ESI MIRA award rates were 29% for the first 2 years (FY 2016–2017) and then increased to 42% from FY 2019 to FY 2021. ESI R01 award rates have fallen from 25% to 17% between FY 2015 and FY 2021.
Award Rates: MIRA and R01 Renewals in FY 2021
Figure 3 shows the award rate for MIRA and R01 renewal applications in FY 2021. In addition to these renewals (both EI and ex-ESI renewals), we also show two cohorts of investigators who sustained their funding at NIGMS by converting one or more R01s (or R37s) to MIRAs, again distinguishing between those who had an eligible ESI R01 (ending in FY 2019 or later; “ex-ESI R01-to-MIRA converts”) and those whose recent R01s were received as EIs (“EI R01-to-MIRA converts”).
Renewal rates were 45% for all R01s, 86% for all MIRAs, and 52% for all R01/MIRA conversions. Figure 3 shows that renewal award rates for ex-ESIs in FY 2021 were 33% for R01 renewals, 72% for MIRA renewals, and 49% for R01/MIRA conversions. Award rates for EIs in FY 2021 were 48% for R01 renewals, 94% for MIRA renewals, and 53% for R01/MIRA conversions. These EI MIRA renewal applications were exclusively from investigators whose first MIRA award was received in FY 2016 or FY 2017, when eligibility was restricted. The first major wave of renewal applications from the broader EI MIRA program is anticipated in FY 2023.
Figure 3. FY 2021 Renewal Rates. Renewal award rates for ex-ESIs were 33% for R01s, 49% for R01/MIRA conversions, and 72% for MIRAs . Renewal award rates for EIs were 48% for R01s, 53% for R01/MIRA conversions, and 94% for MIRAs.
Award Sizes: MIRA and R01 Overall
Figure 4 shows the distribution of award sizes for new awards to EIs in three cohorts: R01 awardees, “early” MIRA awardees (FY 2016 and FY 2017), and “later” MIRA awardees (FY 2018 and onward). The distinction between early and later MIRA awardees is important because of the eligibility restrictions for EI MIRA applicants in the first 2 years of the program (which, as noted above, only accepted EI applications from NIGMS investigators holding either two NIGMS R01 grants or one R01 grant of more than $400k in annual direct costs).
Both the early and later MIRA cohorts had larger average awards compared to R01s. The most typical R01 award increased from $190,000 to $200,000 over the last decade, compared to $250,000 for the later MIRA awards.
Established Investigators Type 1 Award Size (Direct Costs)
Pre-MIRA: FY 2011-2015
Post-MIRA: FY 2018-2021
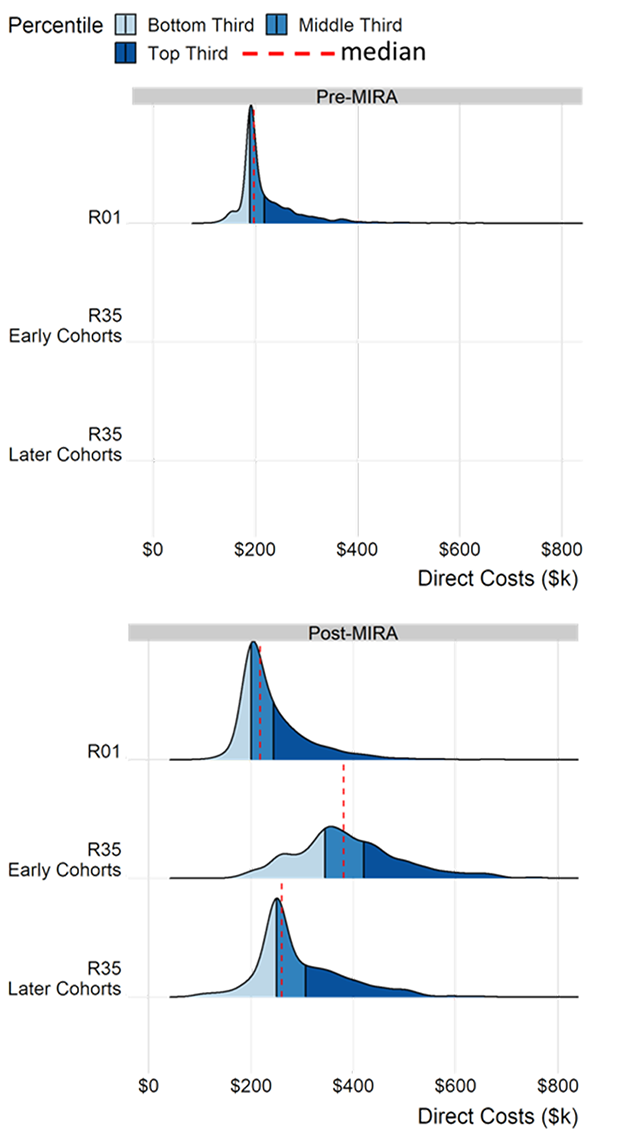
Figure 4. Established Investigator New (Type 1) Award Size Distribution. Prior to the launch of the MIRA program, new NIGMS R01 awards to EIs had a median of $197,500 in annual direct costs, with 12% of those awards at the modal value of $190,000. Since FY 2016, the median has increased to $217,353 with 19% of awards at the modal value of $200,000. Early MIRA awardees had a median award of $380,766 with no prominent cluster. Later MIRA awards had a median value of $260,264 with 22% of awards at the modal value of $250,000. NIGMS generally awards MIRAs of $250,000 to investigators converting from single R01s with budgets less than $250,000.
A similar pattern presents itself in Figure 5 for ESIs, for whom median R01 awards have increased since FY 2015 (from $190,000 to $210,000) while still lagging substantially behind MIRA awards ($250,000). The MIRA awards are also more clustered, with 62% of ESI MIRA awards at $250,000 compared to 19% for the modal value of $210,000 for ESI R01s.
Early Stage Investigators Type 1 Award Size (Direct Costs)
Pre-MIRA: FY 2011-2015
Post-MIRA: FY 2016-2021
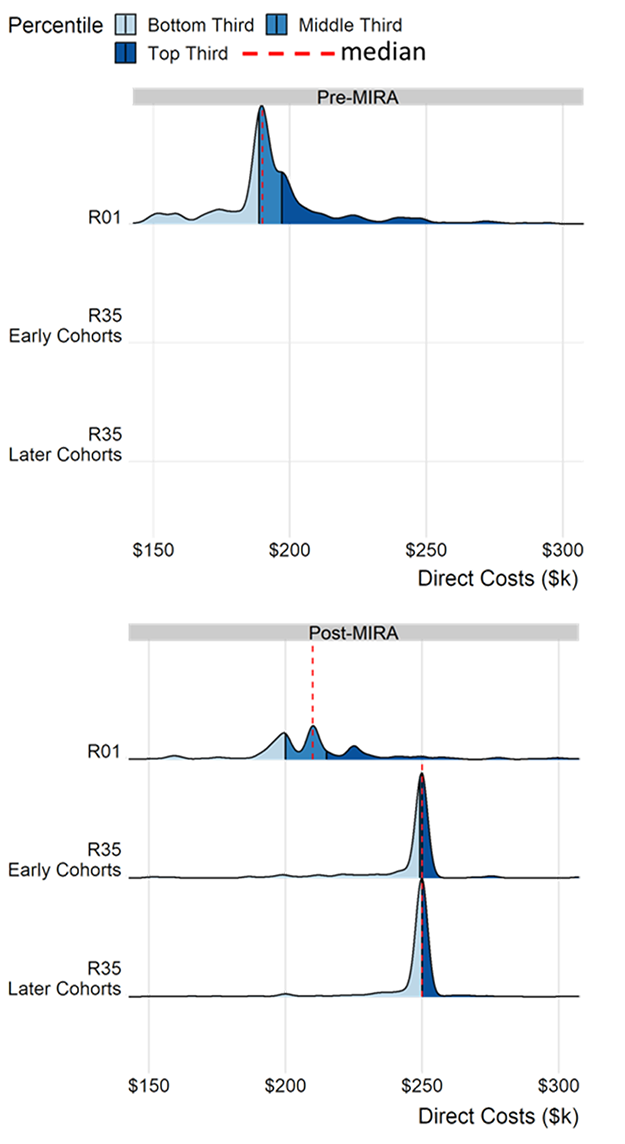
Figure 5. Early Stage Investigator New (Type 1) Award Size Distribution. Between FY 2011 and FY 2015, ESI R01 awards had a median of $190,000 in annual direct costs, which was also the mode comprising 14% of these awards (the same modal value as for EIs). Since FY 2016, the median award increased to $210,000, also the mode comprising 19% of awards. The median ESI MIRA award during that time was $250,000 in annual direct costs. Compared to other cohorts, a much larger fraction of ESI MIRA awards were clustered at a single value, with fully 62% of awards at $250,000.
FY 2021 Renewal Award Budget Changes
Figure 6 shows boxplots of FY 2021 R01 renewal award changes as a percentage of the prior award size by prior funding decile. The median award change for these investigators was an increase of 3%, reflecting large increases for many investigators below the 30th percentile of prior funding and smaller increases for most other investigators. Most investigators receiving cuts were above the 80th percentile of prior funding, and none were ex-ESIs.
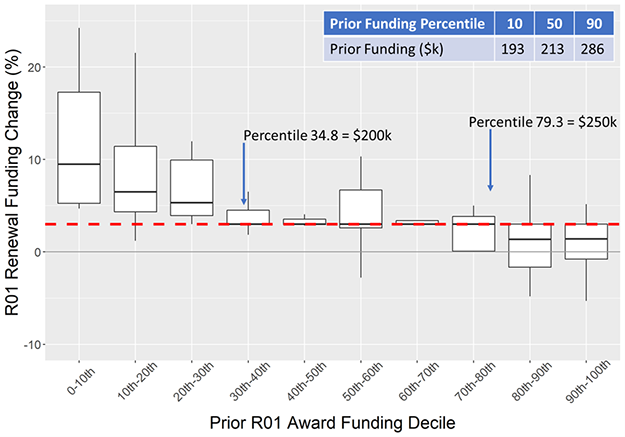
Figure 6. FY 2021 R01 Renewal Award Budget Changes by Prior Funding Decile. The median R01 renewal funding change was an increase of 3%. Most increases over 10% were found among investigators below the 30th percentile of prior funding, and most cuts were among those above the 80th percentile. The median value of prior R01 funding averaged over the previous competing period was $213,000 in annual direct costs (10th and 90th percentiles: $193,000 and $286,000, respectively). Prior funding levels of $200,000 and $250,000 were percentiles of 34.8 and 79.3, respectively. Outliers within each decile are not shown.
Figure 7 shows the FY 2021 renewal award funding changes for MIRAs. Only investigators from the early cohorts of MIRA submitted renewal applications for FY 2021. Almost all investigators received an increase, with a median of 3% and the largest increases concentrated among those below the 20th percentile for prior funding. This median percentage increase is the same as for R01 renewals. However, because the initial MIRA awards were larger on average than the R01s (Figures 4 and 5), in absolute dollars, the median increase for MIRA renewal was nearly double that of R01 renewals at $13,300 and $7,500, respectively. Ex-ESIs were often the largest beneficiary of these increases, having typically received $250,000 or less in direct costs during their prior grant period. Only a handful of R35 renewals received funding decreases of more than 1%.
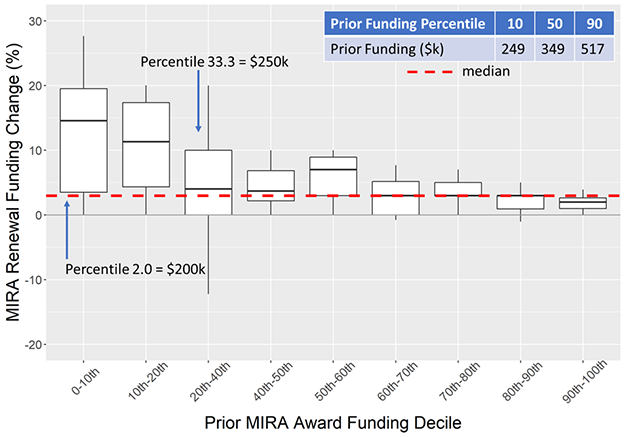
Figure 7. FY 2021 MIRA Renewal Award Budget Changes by Prior Funding Decile. The median MIRA renewal funding change was 3%. A cluster of 28 investigators with $250,000 in prior funding (all but two of whom are ex-ESIs) span two deciles (20th–40th) and are plotted together. Nearly all investigators received a budget increase. The median value of prior R35 funding averaged over the previous competing period was $349,000 in annual direct costs (10th and 90th percentiles: $249,000 and $517,000, respectively). Prior funding levels of $200,000 and $250,000 were percentiles of 2.0 and 33.3, respectively. Outliers within each decile are not shown.
Figure 8 shows the change in funding for investigators converting R01s or R37s to MIRAs in FY 2021. The average change was an increase of 14%. Compared to R01 and MIRA renewals, there’s an even stronger inverse relationship between the funding change and the amount of prior funding for these R01/MIRA conversions. This trend is in keeping with the budget principles for MIRA described in our FAQs. R01/MIRA conversions below the 30th percentile for prior funding received increases near 25%, while the median change for those between the 40th and 90th percentiles was 4%. Investigators above the 90th percentile for prior funding received a median funding decrease of 11%.
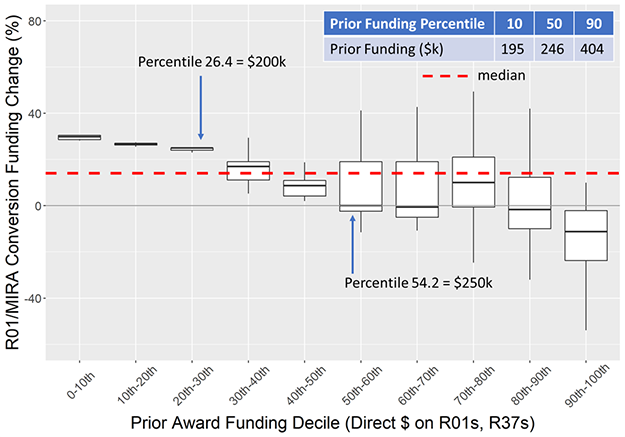
Figure 8. FY 2021 Award Budget Changes for NIGMS R01/R37-to-MIRA Conversion by Prior Funding Decile. The median funding change for investigators converting their R01s or R37s to MIRAs was an increase of 14.1%. Almost all investigators below the 50th percentile for prior funding received increases, with the largest increases going to investigators below the 30th percentile. Investigators in the 50th to 90th percentile were about as likely to receive an increase as a decrease with most changes between -25.0% and +25.0%. Most investigators in the 90th to 100th percentile for prior funding received cuts. The median value of prior R01 and R37 funding averaged over the previous competing period was $246,000 in annual direct costs (10th and 90th percentiles: $195,000 and $404,000, respectively). The prior budgets shown reflect costs of all NIGMS R01s and R37s to the investigator and do not include funding from non-NIGMS sources. Prior funding levels of $200,000 and $250,000 were percentiles of 26.4 and 54.2, respectively. Outliers within each decile are not shown.
As this post illustrates, MIRA conversion and renewal rates are more favorable than comparable R01 renewals, and MIRA award sizes are larger than R01 awards. In addition, MIRA renewals remain larger in total dollar terms than comparable R01 renewals. All grant types saw greater increases for investigators with lower levels of funding than those with larger levels of prior support. NIGMS remains dedicated to supporting a broad and diverse portfolio of fundamental biomedical research and will continue to monitor trends such as award rates and sizes in its grant portfolio to ensure proper stewardship of taxpayer investments.
I noticed that the award rates for new R01s from established investigators (EIs) fell from 21% in 2017-20 to 17% in 2021 (Fig. 1). Was this a temporary blip or does it mean that new R01s from EIs are less likely to be funded in the future?
Award rates are contingent on a number of factors, including incoming applications and overall budget. We do not know yet if the dip in FY 2021 will be a trend, but we will continue to monitor these and other data.
What difference does any of this make to any of those who have never landed or can never land a R01 or convert to MIRA or whatever new NIH experiment comes along. There is a mid career cohort of scientists that is entirely lost, and likely lost for good, in the NIH career transition “experiments” and associated studies on success stats.
I wanted to ensure I understand the definition of ‘award rate’. In the article, it says the award rate= percentage of reviewed applications. When you say reviewed do you mean discussed (and received scores) or received applications (roughly)?
“Award rate” includes everything that was reviewed, regardless of whether it was discussed/scored. It also counts amended applications (A1) separately from the originals (A0) as long as both applications were submitted in the same fiscal year.
I had a question about ESI MIRA renewal rates. They look quite good at ~72%. My question is about how that was calculated.
Simply, was that 72% of the total possible ESI MIRAs were renewed? Or was it 72% of all the submitted ex-ESI renewal applications were approved for funding?
Basically, I’m trying out to see if PIs that chose not to submit a renewal are skewing that 72% number downward or not.
It’s the latter–72% of submitted MIRA applications from ex-ESIs were funded.
Three questions:
1. What was the primary cause of the disparity in renewals between ex-ESI and EI MIRA awards? 22% is quite a difference.
2. Is there a plan to update these numbers with the next year’s renewals and success rates?
3. Since over 1 in 4 ex-ESI MIRA holders were not renewed, what are their options for more NIGMS funding? I’m sure that they submit a new R01 to continue the research they were doing in the MIRA, but is there an opportunity for them to go back into the MIRA pool?
MIRA awardees’ eligibility to apply for a renewal or a new MIRA expires at the end of the fiscal year after the one in which the original MIRA project ended, which allows MIRA PIs multiple opportunities to submit a MIRA application. We will continue to monitor and publicize these sorts of data.